Climate Change Quilts
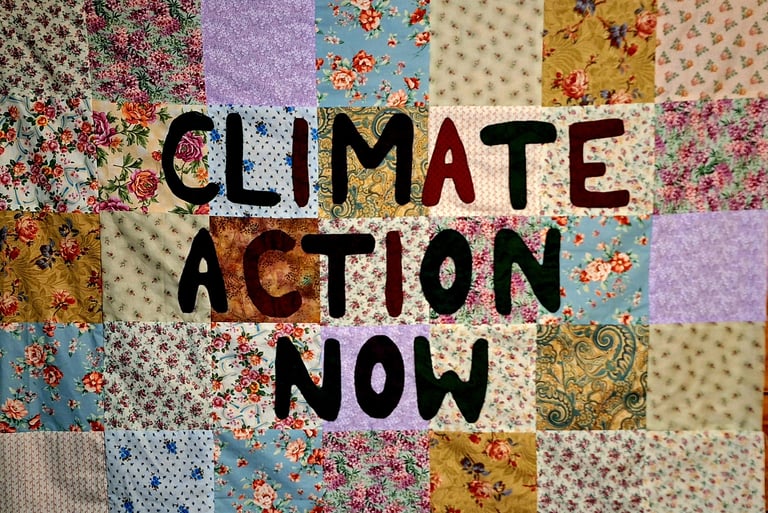
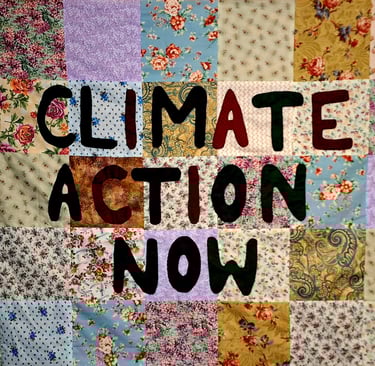
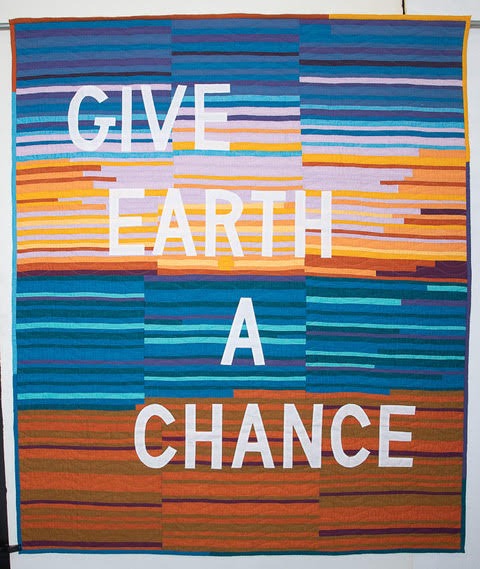
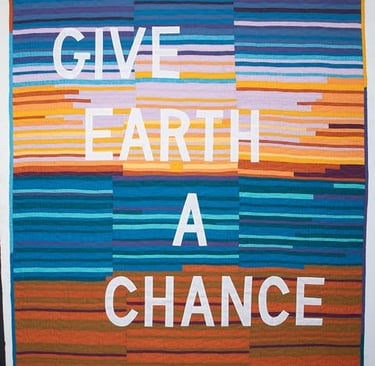
Climate Action Now
Designed by: Pamela A. Mischen
Created by: Pamela A. Mischen, Christopher Robbins, Amanda Truin
This quilt is a more traditional patchwork quilt made from 10"x10" squares with Climate Action Now done as an applique. Quilts, traditionally crafted from leftover fabric scraps, or worn-out clothing, and other discarded textiles, represent the concept of upcycling and transformation. For this display, the fabrics used have been donated, thrifted, and purchased from individuals who are “clearing out their stash.” We have avoided the use of fabric purchased at retail specifically for this project. This choice reflects our commitment to the zero-waste concept for climate change mitigation and emphasizes that what some may view as “trash” can be repurposed into both beautiful and functional items. In a world that often discards the old and the unwanted which contributes to overconsumption and pollution, we demonstrate that there is power in transformation.
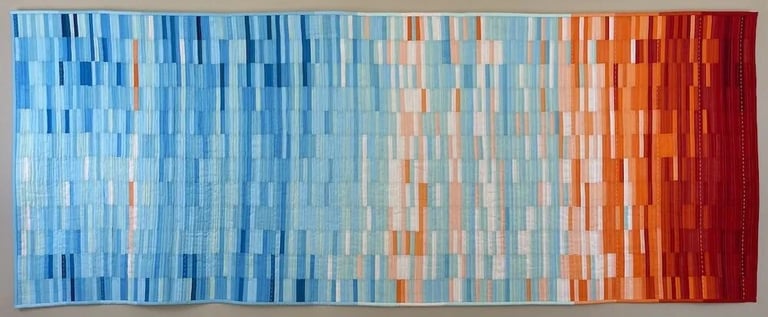
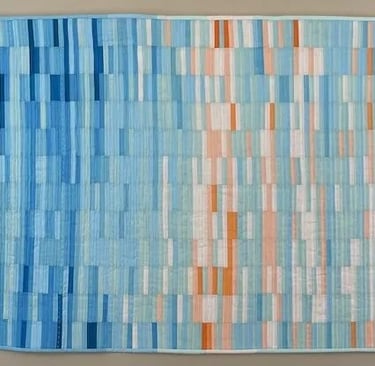
You’re Getting Warmer: Rising Global Temperatures 1850-2022
Made by Lorraine Woodruff-Long
2020, 36”x92” Cotton top, batting, back. Machine pieced, machine & hand quilted
This quilt illustrates the global change in temperature for every year and month between 1850 (left) to 2022 (right). Each vertical line is a year reflecting temperature data for the 12 months of that year, January (top) to December (bottom). Blue represents cooler years/months and red, warmer years/months. Darker colors indicate more extreme temperatures in both directions. The color of each strip represents the temperature change of that year/month relative to the 1961-1990 mean (i.e. the average of the data during 1961-1990 is zero). Each block (2064 months) measures ½” x 3”.
The overall effect reflects a striking trend toward hotter temperatures in recent decades as a result of human-caused climate change. (Data Source: Professor Ed Hawkins MBE, National Centre for Atmospheric Science, University of Reading, UK www.showyourstripes.info)
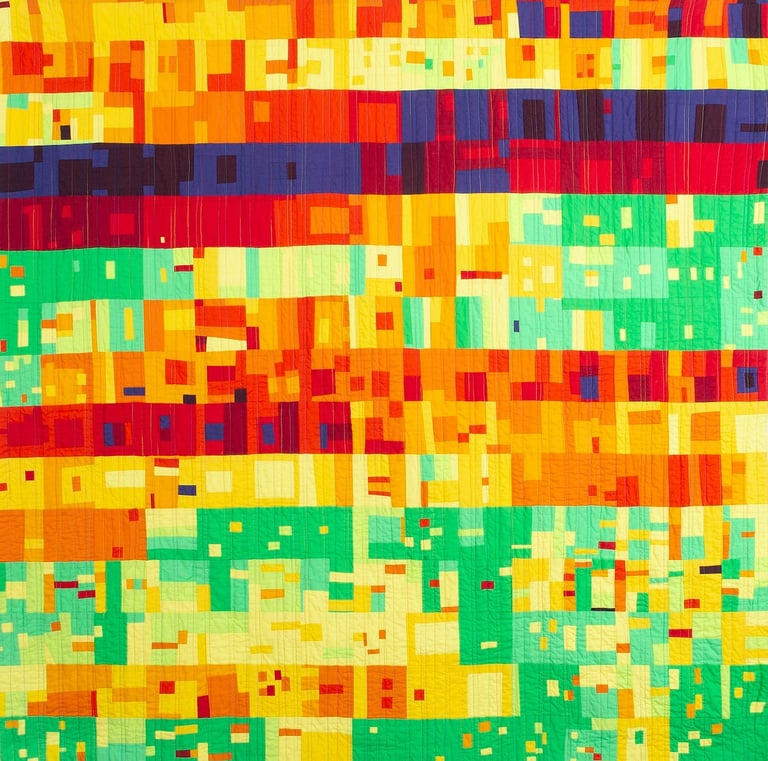
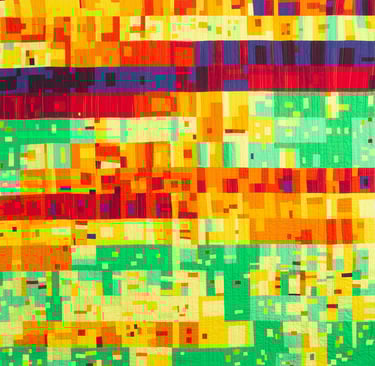
San Francisco Air Quality Fall 2020
Made by Lorraine Woodruff-Long
2020, W60″xH60″, Cotton, Machine-pieced & quilted
For weeks, millions of Californians were smothered by smoke from a record explosion of wildfires burning through grass, shrubs, conifer forests, homes and businesses. Many cloistered themselves indoors as pollution spiked to “hazardous” levels, or worse. Smoke transported health dangers to nearly every corner of the state. Even as air quality begins to improve, many remain worried about the long-term health impacts on residents.
This quilt was made as the fires raged from September 3 through the first rains of the season on November 8, 2020. Each 4 inch square was modeled from screen shots captured on PurpleAir.com of the outdoor Air Quality Index of San Francisco. The higher the AQI value, the greater the level of air pollution and the greater the health concern. Air quality ranged from purple/red (hazardous/unhealthy), to orange/yellow (unhealthy for sensitive groups/moderate) to green (good/satisfactory.) San Francisco’s microclimates and hilly terrain causes much variety in the small 7×7-mile city, as indicated by the varied confetti and bar colors at any one point in time.
Experts say these kinds of wildfires will become routine if we do not take significant action to adapt to climate change and reduce greenhouse-gas emissions.
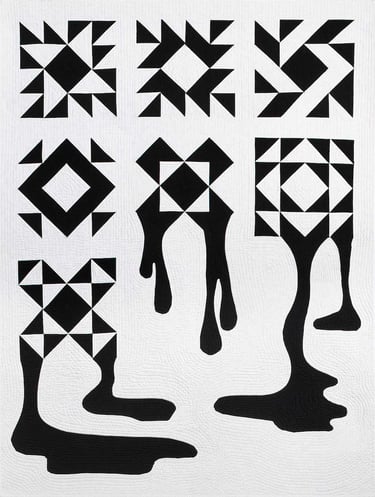
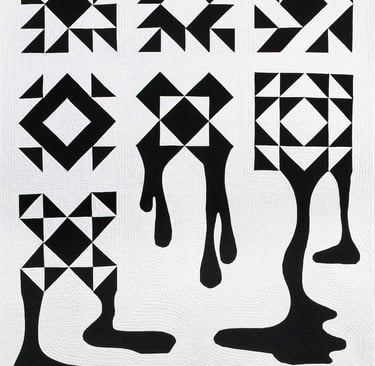
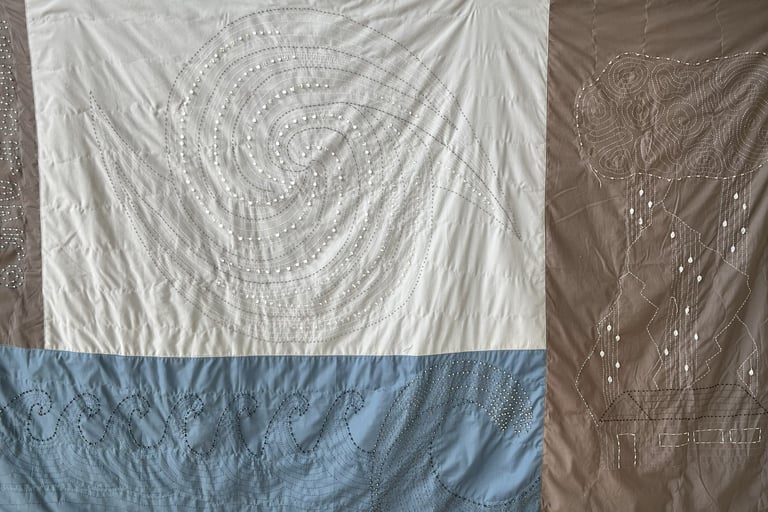
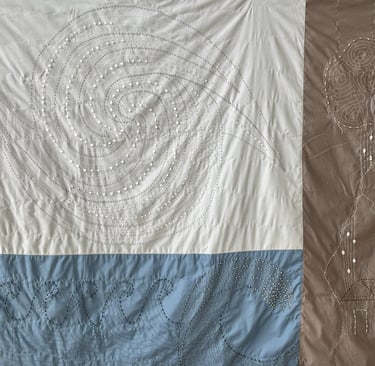
Quilt Melt
Made by Lorraine Woodruff-Long
2017, W44″xH57″, Cotton, Combination of machine pieced and hand appliqué and machine quilted.
Scientists agree that the changes in climate that we are seeing are largely caused by human activity, and its is climate change that drives sea level rise. This will continue to have a dramatic effect on coastal cities and communities as we know them today. In the US alone, 13 million people could be forced to relocate due to rising sea levels by 2100. As a result, cities throughout the country will grapple with new populations. Effects could include more competition for jobs, increased housing prices, and more pressure on infrastructure networks.
Quilt Melt illustrates melting of the ice caps through formal and familiar traditional quilt blocks (current coast areas) contrasted with the unexpected fluidity and change of a surrealist melting appliqué (melting ice caps.)
As the Canadian filmmaker Alanis Obomsawin, of the Abenaki tribe writes, “When the last tree is cut, the last fish is caught, and the last river is polluted; when to breathe the air is sickening, you will realize, too late, that wealth is not in bank accounts and that you can’t eat money.” This cautionary wisdom echoes the urgency of our work, reminding us of the transformative potential of individual actions toward sustainability and preservation, especially when carried out through collective projects like quilt-making. Each stitch of this quilt is a step toward honoring and restoring the earth.
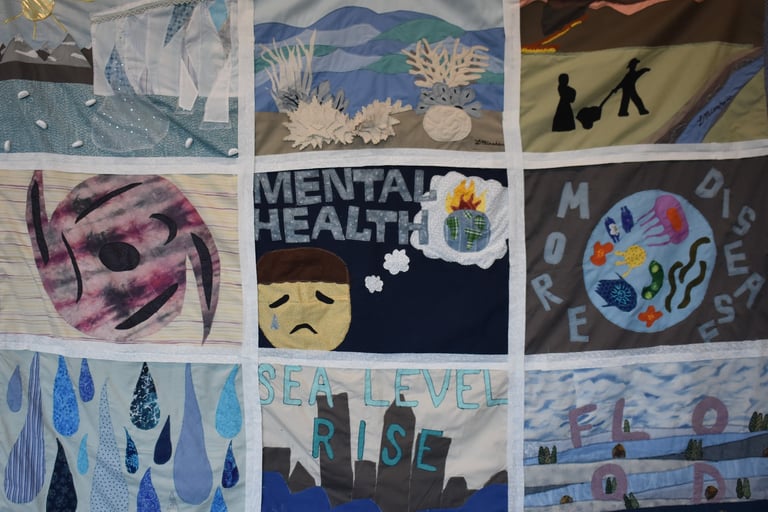
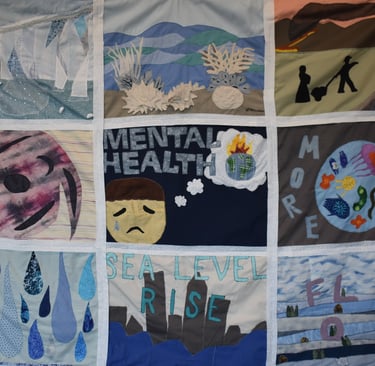
Consequences of Climate Change
Quilt Contributors:
Glaciers Melting- Natalie Kachmarik
Coral Bleaching- Linda Mischen
Wildfires- Linda Mischen
Tropical Storms- Lois Grady-Wesbecher, Charlotte Li
Mental Health- Prawravee Pothiwit
Extreme Precipitation- Karen Jennings-Klaskowski, Linda Mischen
More Disease- Prawravee Pothiwit
Sea Level Rise- Charlotte Li and Laurie Kern
This quilt highlights some of the direct and far-reaching consequences of climate change. According to scientific research, 90% of the heat generated by global warming has been absorbed by the oceans, leading to a cascade of environmental impacts. As ocean temperatures rise, tropical storm activity intensifies, and the ocean’s acidification from dissolved carbon dioxide in the water accelerates, contributing to the phenomenon of coral bleaching. It is estimated that even at 1.5 degrees Celsius of global warming, 80% of coral reefs will die, a loss with devastating implications for marine biodiversity. Warming is also leading to the melting of polar ice caps and glaciers globally. The added water from melting plus thermal expansion of the ocean are contributing to sea level rise.
A warmer atmosphere holds more moisture, which paradoxically leads to both drought and flooding. Droughts occur because the atmosphere can hold more water, leaving less moisture in the soil, while heavy precipitation events and atmospheric rivers – when the atmosphere can no longer hold the excess moisture – trigger torrential rainfalls and catastrophic flooding. Drought also increases the frequency of wildfires, which are becoming hotter and more destructive due to stronger winds created by intensified storm activity (video link). As wildfires ravage landscapes, they leave denuded areas which are highly susceptible to mudslides when the rains finally come.
Of increasing concern to scientists is the destabilization of key atmospheric systems, such as ocean currents and the jet stream. The destabilized polar vortex is one prominent example of this impact. It may seem paradoxical, but global warming is bringing freezing temperatures to places like Texas and the Gulf coast, demonstrating how climate change disrupts weather patterns in unpredictable ways.
Additionally, a warming world creates favorable conditions for the proliferation of disease vectors such as ticks and mosquitos. Warming weather has also extended allergy season in temperate parts of the world, and flooding events can lead to waterborne disease outbreaks as well as increased allergy activity from mold.
Finally, all of these impacts are taking a toll on the other life forms with which we share this planet. Scientists agree that climate change is a major driver of the sixth mass extinction event currently underway. It is estimated that 30% of all life forms will go extinct by 2100 if climate change continues unabated.
Hurricanes
Quilt design and embroidery by Pamela Mischen. Binding by Dianne Wessell.
This quilt reflects the fascination and fear evoked by hurricanes. The embroidery is inspired by a Japanese technique called sashiko. Sashiko has traditionally been used to mend clothes in a way that adds beauty to the garment.
Climate change has significantly impacted tropical storm activity in recent decades. One of the most notable effects is the warming of ocean waters, which serve as the primary energy source for tropical storms. As sea surface temperatures rise—particularly in tropical regions—storms can become more intense. This means we’re seeing an increase in the number of powerful hurricanes, particularly Category 4 and 5 storms. Warmer air can also hold more moisture, which leads to heavier rainfall during storms. In addition, warmer oceans are contributing to more rapid storm intensification, reducing the time available for communities to prepare.
Another major consequence of climate change is sea level rise, caused by melting glaciers and the expansion of warmer ocean water. Higher sea levels lead to more severe coastal flooding during storms, even if the storm itself isn't stronger. Storm surges can now reach farther inland, threatening more homes and infrastructure than in the past.
While the total number of tropical storms and hurricanes worldwide may not be increasing, their distribution and behavior are changing. For instance, the North Atlantic has seen a rise in hurricane numbers since the 1980s. Some climate models predict that there may be fewer storms overall, but a larger proportion of them will be intense. There is also growing evidence that some storms are moving more slowly over land, which can lead to prolonged rainfall and greater destruction.
These changes are not uniform across the globe. In the Atlantic basin, hurricane seasons have become longer and more active, while the Western Pacific has experienced an uptick in storm intensity, though with more variability. Regions that historically were not prone to tropical storms are now becoming more vulnerable as patterns shift.
Scientific consensus, including assessments from the Intergovernmental Panel on Climate Change (IPCC), supports these observations. The IPCC reports high confidence in the increase in storm intensity and rainfall due to climate change, and medium confidence in the projections around changes in storm frequency. The relationship between climate change and tropical storms is complex, but the trends point to more intense and damaging storms in a warming world.
Drought
Quilt by Pamela Mischen, Prawravee Pothiwit, Charlotte Li
Many regions of the world, already struggling with dryness, will face even drier conditions. This includes some of the most productive farmland in the United States as well as critical agricultural zones in Asia and Southern Africa. Changing monsoon patterns could lead to drought in the Punjab and other critical food growing areas around the world. Along with rising disease pressures, drought will contribute to an estimated 25% drop in global food production by the end of the century – all while the global population is expected to increase by 3 billion people, intensifying demand and stress on resources.
As droughts grow longer and more intense, staple crops struggle to survive, let alone produce enough yield to support human and livestock populations. Crops that depend heavily on irrigation are particularly vulnerable. Yields will decline not only because of limited water availability, but also due to increased pest infestations and the depletion of essential nutrients in soil under high heat and dry conditions. Crops like soy and wheat, for example, are especially susceptible.
You can learn more about drought's impact on crop yields here.
Reduced crop yields and supply chain disruptions will drive food prices higher – an escalating concern in global political stability. The Arab Spring, for example, is now widely linked to spikes in food costs. Continuing climate stress could force over55 million people to migrate from their homes between the middle and end of this century, as rising temperatures and water scarcity make regions increasingly uninhabitable.
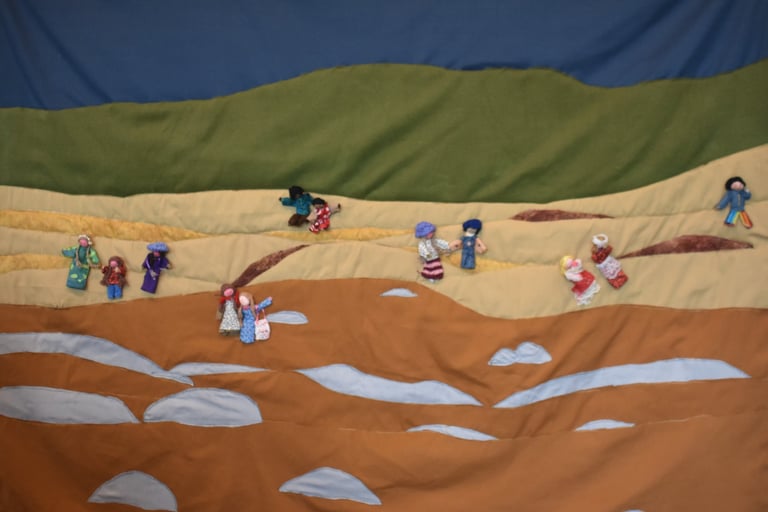
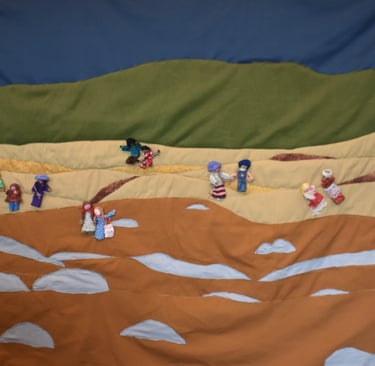
Climate Migration
Quilt by Pamela Mischen. Figures by Annelise Heurich.
This quilt illustrates the heart-wrenching scene of families and communities uprooted by climate disasters – forced to abandon their homes, lands, and histories in search of safety and shelter. Each stitch captures a story of loss, resilience, and the profound human cost of a rapidly warming world. The combined forces of sea level rise, intensified tropical storms, flooding, drought, wildfires, extreme heat and land desertification will make parts of the Earth unlivable. It is anticipated that millions of people will be displaced as a result of climate change. Some may be displaced by these impacts directly, while others may be forced to migrate due to political instability that can be triggered by rising food prices and resource shortages.
The climate migrant crisis is global and interconnected – its impacts cross borders, economies, and generations. From the Pacific Islands slowly swallowed by rising seas, to coastal cities in the United States battered by stronger hurricanes and
relentless erosion, from the Horn of Africa to Central America’s dry corridor where crops can no longer grow, climate displacement is already unfolding at a staggering pace. The ashes of the LA wildfires still hang heavy in our air, in our very own neighborhood – hundreds of people have lost their homes and now have no place to call their own, and just this year, massive floods in Pakistan displaced over a million people, submerging entire communities under water and wiping out livelihoods. While the scale of the crisis is immense, the future could be in our hands if we act now.
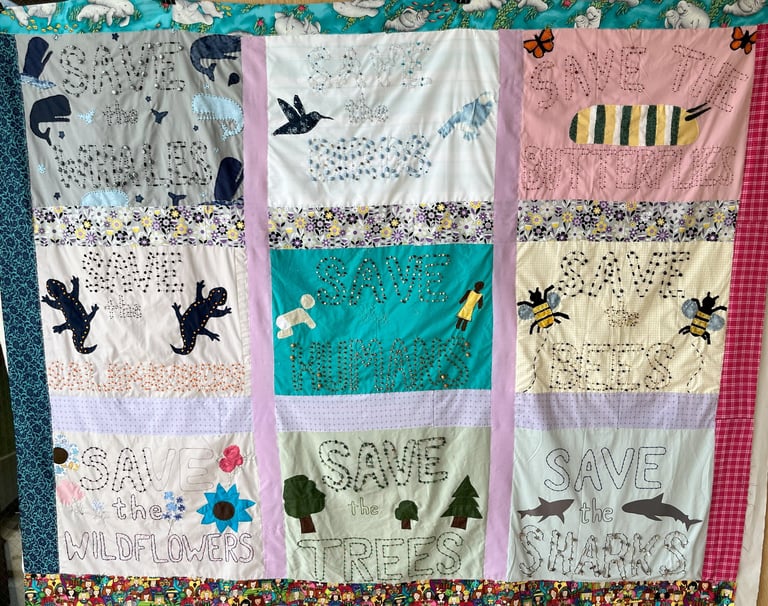
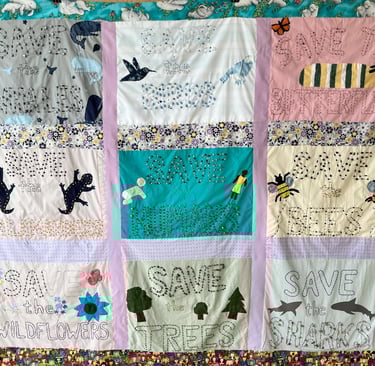
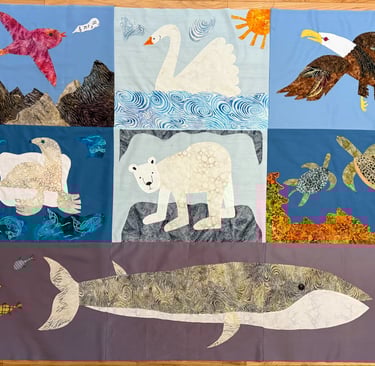
Save the Whales (& Humans)
Quilt design and embroidery by Pamela Mischen
Quilt contributors: Charlotte Li, Margaret Saville, Tyler Linnehan, Olivia DeSilva, Prawravee Pothiwit
Do you remember Save the Whales? This quilt, crafted from nine 18"x24" squares with Save the Humans in the middle, is a tribute to the interwoven fates of our planet’s creatures and the urgent fight for our collective survival. These squares are stitched with a combination of running stitch, embroidery floss, and beads from thrifted necklaces, while appliqued elements breathe life into this poignant message.
You may think that whales have been protected by the 1986 worldwide ban on commercial whaling, a victory heralded by the iconic Save the Whales movement, which marked a powerful alliance responding to the global crisis of drastically dwindling whale populations and declining marine biodiversity. Sadly, the slaughter continues today in dark corners of the world. Whales and countless marine species, like dolphins, seals and sea birds still face grave threats from destructive human actions such as Navy “ship shock” explosives detonations, salt mining operations, capture and captivity, entanglement in fishnets and drowning, and urban runoff.
In this fight, we need more voices and forces. We need you.
The health of the whale is the health of the sea, and the health of the sea is the health of the earth. Whales are not just majestic beings; they are pivotal to the balance of marine ecosystems. Whale carcasses provide vital nutrients to deep-sea species, and their fecal matter promotes the growth of plankton, which absorbs carbon dioxide from the atmosphere, helping to regulate the global climate. As apex marine predators, whales are at the top of a delicate food chain that sustains biodiversity and the oceanic systems we rely on for our own survival, including food source. Their decline due to hunting, pollution, and climate change can have cascading effects on the ecosystems. Without these marine giants, the fragile balance of life that sustained us all begins to collapse.
Save the whales, the majestic and vulnerable children of the ocean!
Save the birds, whose wings are being broken and whose songs are choked by the toxic dark smoke from the chimneys!
Save the salamanders, whose ancient journeys upstream to grow their young limbs and find their mates are severed by human-made dams!
Save the bees and wildflowers, who offer their sweetest honey dews and nectars through their delicate dance of pollination but now face extinction as their habitats are being destroyed!
Save the trees-- over 17,000 tree species are at risk from rapid global change
And let’s not forget about the sharks! They are not villains. Hunt for their beautiful fins, their number is declining at a staggering rate. Their absence will send a shockwave to the ocean food chain, leading to collapses that echo far beyond the waterspace. Save the sharks, whose sleek, silent paths through the currents are the signs of a living, breathing sea.
For in saving these, we are also saving ourselves – our future, our mother planet, our very survival.
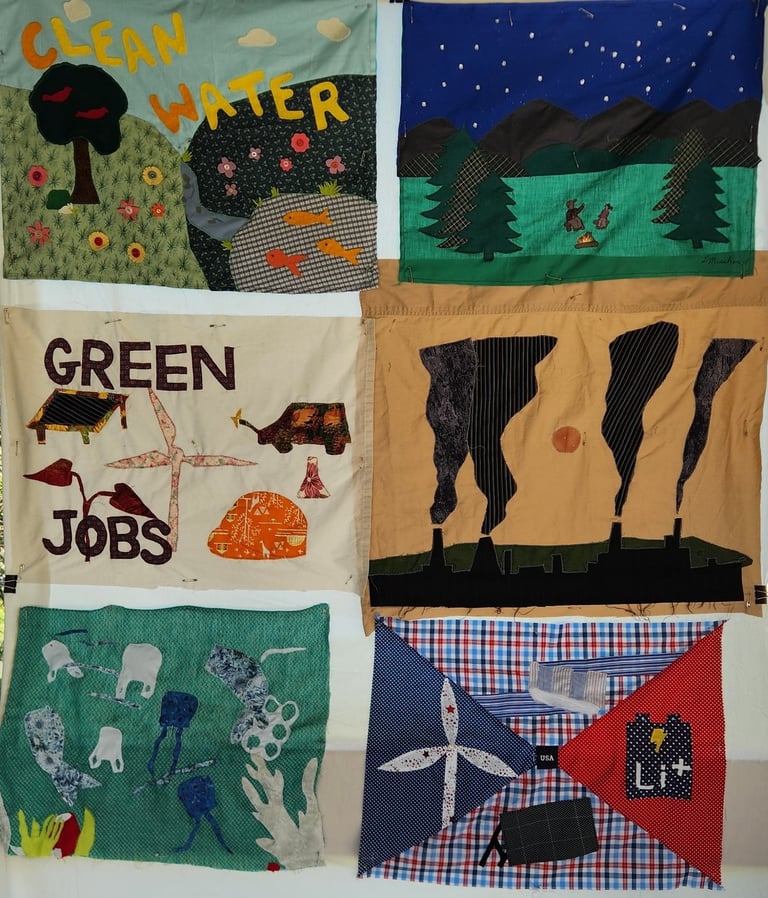
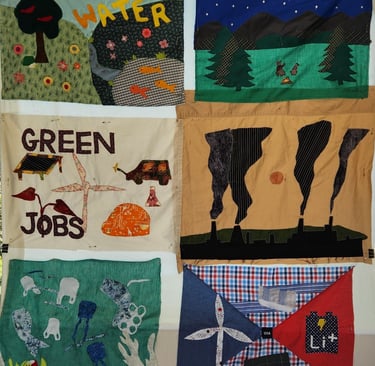
Co-Benefits
Quilt Contributors:
Reduced Light Pollution- Linda Mischen
Clean Water- Carol Kulp
Reduced Plastic Pollution- Dominique Muñoz & Bryson
Energy Security- Natalie Kachmarik
Green Jobs- Sophia Decesare
Reduced Air Pollution- Charlotte Li
Imagine this: turning on the tap and tasting water so pure it needs no filter. Picture gazing at the shimmering stars from a crystal clear sky, hand in hand with your loved ones. Envision more green jobs that restore rather than destroy the planet, that heal our earth rather than hurt. No more black smoke curling into the sky and poisoning our lungs like a slow venom. Gone are the plastic islands floating in the ocean and microplastics clogging our veins. Only joyful communities powered by the rustling wind through turbines, the golden dance of sunshine on our rooftop panels, the steady pulse of hydroelectricity from a nearby river, all clean, local energy that frees us from distant dependence. Who wouldn't want a world like this?
These aren’t just fantasies. They are the quiet and powerful rewards – the real, measurable co-benefits when we shift course, when we act with intention, together. The beauty of this is: change doesn’t have to be loud to be profound. It begins in small, consistent acts – choices that ripple outward. And when enough of us choose to move together, those ripple acts become a wave, a wave that carries us toward a livable future we all deserve.
Species at Risk
Quilt Contributors:
Polar Bears- Anchilla Inocencio
Bees- Katie Li
Chinook salmon- Charlotte Li and Laurie Kern
Green sea turtle- Charlotte Li
Adelie penguin- Charlotte Li
Asian elephant- Jamie McManmon
The photo of the polar bear stranded on the iceberg has become one of the iconic representations of climate change. Climate change is driving many species toward the brink, from the majestic Asian elephant to the tiny Chittenango snail, a rare, endemic land snail found only at Chittenango Falls State Park in central New York. Some of these species, such as bees and the Chinook salmon, play a critical role in our food systems, whose decline could have devastating consequences for biodiversity and food security.
While humanity has the ability to adapt quickly and survive in a wide range of climates, many animals in the natural world do not, including these depicted here: the Chittenango Ovate Amber Snail, Polar Bear, Bee, Coral, Chinook Salmon, Green Sea Turtle, Adélie Penguin, and Asian Elephant. Climate change is driving ecological stressors at an increasingly accelerated rate.
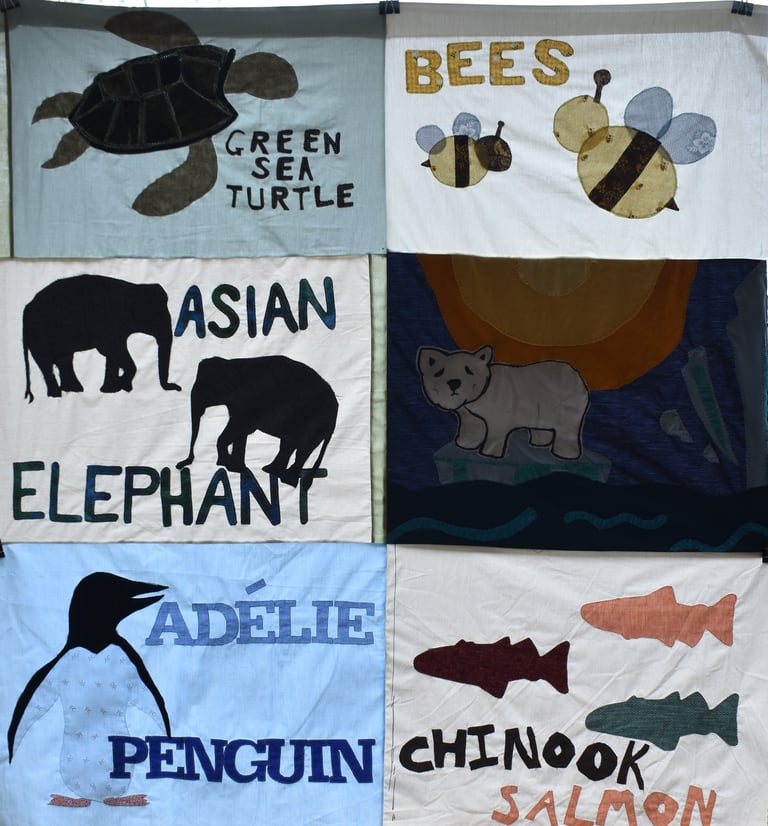
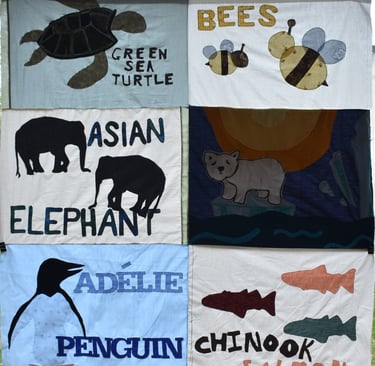
This quilt represents a handful of species – both large and small – that are already feeling the consequences. As of 2021, over 10,000 species on the IUCN Red List are being negatively affected by climate change.
Often, we hear about the impact of climate change on distant creatures like polar bears, coral reefs, or sea turtles, and it can feel removed from our own lives. But a stable climate is essential for the balance of ecosystems everywhere. One local and critical example is the pollination of plants by bees. Bees are facing significant risk from climate change due to shifting seasonal patterns, extreme weather, and the spread of disease and fungi. Managed honey bee colonies are experiencing nearly a 40% annual decline—an alarming trend that affects agriculture, food supply, and biodiversity.
Another species deeply affected is the Chinook Salmon, one of the largest salmon species, found on the West Coast of the United States. Its population has declined to just 10% of historical numbers. The Chinook has played an essential role in its ecosystem and in the cultures of First Nations and Indigenous tribes for thousands of years. This decline has become especially pronounced since the mid-1980s.
Closer to home, we see similar impacts. The Chittenango Ovate Amber Snail, found only in Chittenango Falls State Park near Cazenovia, NY (about 90 minutes from Binghamton), is critically endangered. As of 2023, its population has increased slightly to around 70 individuals—still teetering on the razor’s edge of extinction. It is one of many species whose survival is threatened by the compounding effects of climate change.
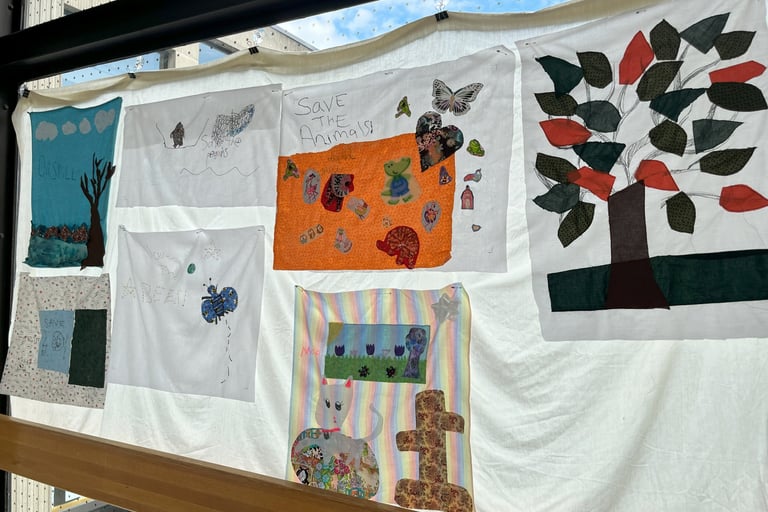
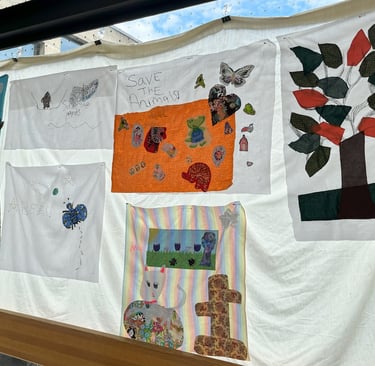
NoMa (North of Main) Quilt
Quilt Contributors:
Mailani Glover "Save the Trees"
Adara Villaronga "Oil spill!"
Lucia and Ana Lura Elias "MAKO"
Jane Elliott and Daria Nadell "Save the Earth"
Christal Rivera "Save the Penguins"
Jaliyah Ware-Powell "Save the Animals"
Melissa, John, and Josephine “Save the Bees”
As part of the Climate Change Quilt project, we partnered with NoMa’s Aspiring Artists Workshop—a Saturday morning program where families come together to share breakfast and explore new skills through art. This time, the spotlight was on climate change.
The children, ranging from about 4 years old to early teens, were guided to think creatively about the planet and the environment. They started by brainstorming ideas around what it means to care for the Earth, drawing inspiration from sample quilt panels made by others. Many focused on themes of protection and preservation—leading to powerful messages like “Save the Trees,” “Ocean Isn’t a Trashcan,” and “Save the Penguins.”
The young artists chose patterned fabrics, cut their designs, and used hot glue to begin assembling their quilts (which were later sewn by volunteers). The result is a vibrant and heartfelt collection of quilt squares that reflect not only their creativity, but also their concern and hope for the future. These quilts are a beautiful reminder that even the youngest members of our community have something important to say about climate change—and that their voices matter.
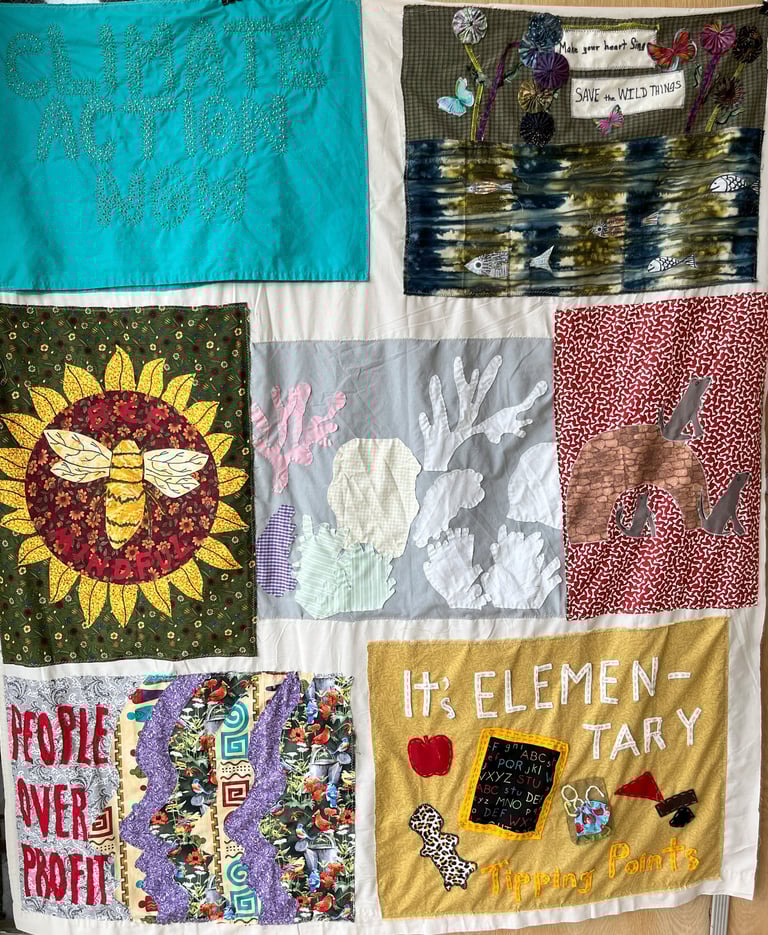
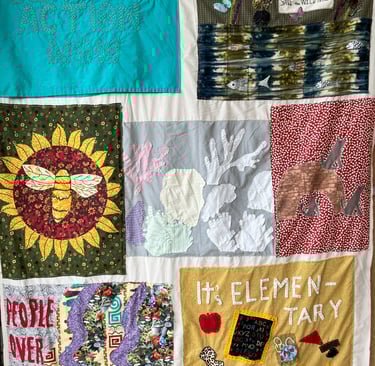
Miscellaneous
Quilt Contributors:
Save the Wild Things- Diana Tillotson
Bee Mindful- Donna Dajnowski
It’s Elementary- Eileen Patch
Coral Bleaching- Liyang Dong
People over Profit- Erin Zipman
Wolves- Taia Nikulina
This quilt brings together a powerful array of climate-themed squares under a 'Miscellaneous' banner—each one a window into the creator’s personal connection to the climate crisis. Instead of focusing on a single theme, these pieces reflect the individual hopes, fears, and convictions of their makers, emphasizing the deeply human side of environmental change.
One square features the image of a wolf, inspired by a little girl’s worry that these majestic animals might one day disappear forever. Her concern is more than symbolic—wolves are keystone species that help maintain balance in many ecosystems. Their loss would ripple through food webs, altering entire landscapes. In another square, stark white corals float against a fading blue sea, raising awareness of coral reef bleaching. As ocean temperatures rise, these once-colorful reefs—home to a quarter of all marine life—are dying at an alarming rate, representing one of the clearest indicators of climate disruption.
Yet another square carries a bold message: 'People Over Profit.' It’s a statement of values, reminding us that the fight against climate change isn’t only about carbon and conservation—it’s also about justice. The impacts of climate change disproportionately affect vulnerable communities, and this square demands that we prioritize human dignity and well-being over economic gain.
Each square in this quilt may appear different, but together they form a unified statement: that climate change is personal, emotional, and urgent. This patchwork of stories reminds us that while the science is global, the experience is deeply individual—and that every voice matters in the work of healing our planet.
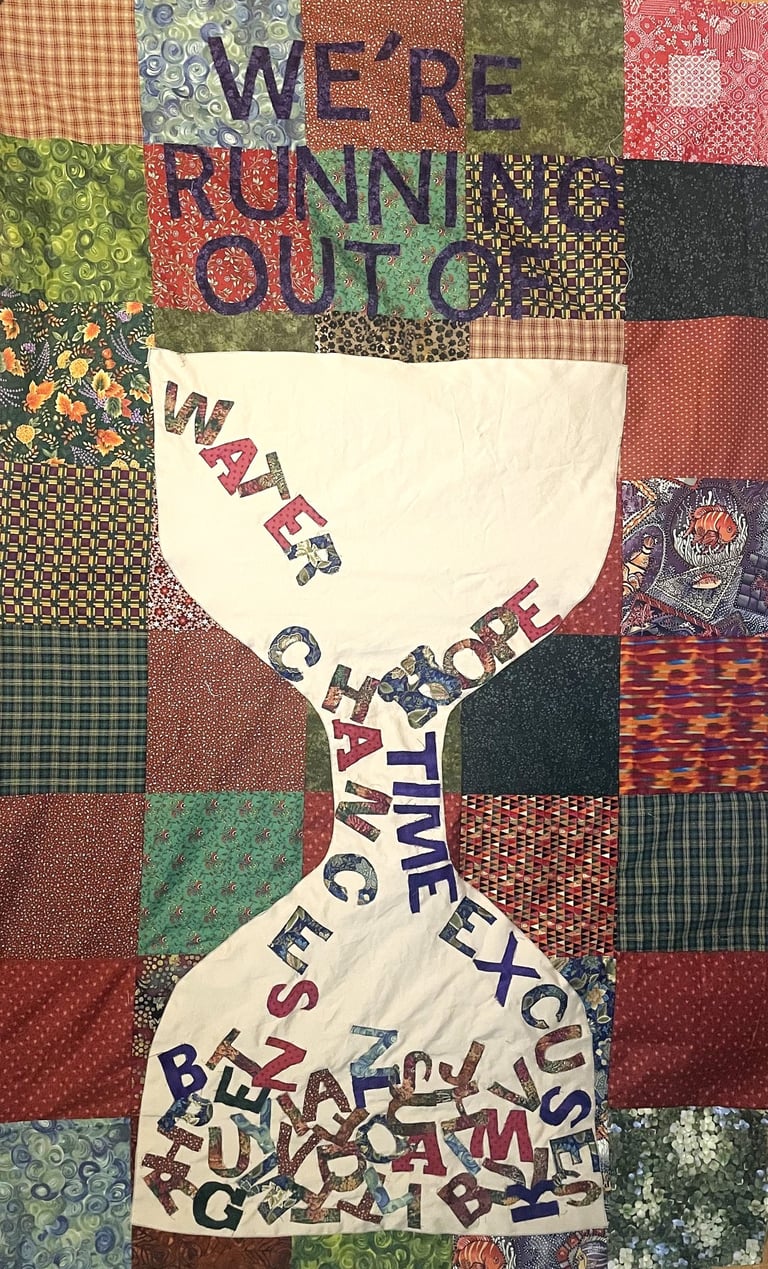
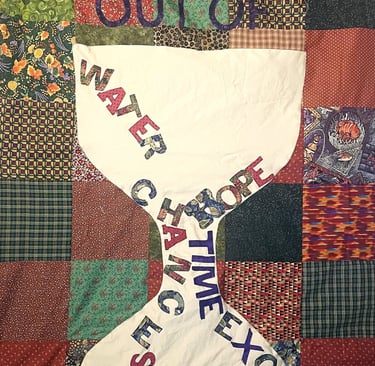
We’re Running Out of . . . .
Quilt design by Pamela Mischen
Time, chances, excuses, hope. . .
Safe seasons, breathable air, drinkable water, and arable land.
Coral reefs, pollinators, wild fish, king crabs in Alaska, and fertile soil.
We are running out of certainty, stability, and the quiet faith that tomorrow will resemble today.
We are running out of stories we can tell our children and grandchildren about oceans that run bluer than the sky.
We are running out of the luxury to believe that this isn’t our fight.
Climate change is not a sudden storm. It is a vast, constantly moving ocean liner headed for the docks. It has momentum. . . and the consequences of our actions today will not be felt until far into the future when it may be too late to affect change. These lags that are part of the climate system can give us the false impression that we still have plenty of time to make the needed corrections.
In reality, we have less than 20 years to fully decarbonize our economy. Even with this aggressive timeline, we have already committed the Earth to at least 0.5 to 1 meter of sea level rise, along with more extreme weather events, ecosystem disruptions, and widespread climate migration by the end of the century. Additionally, global temperatures are on track to surpass 1.5°C above pre-industrial levels as early as the 2030s, increasing the risk of irreversible climate tipping points.
You may have heard that the top 1% of global income earners are responsible for 80% of the greenhouse gas emissions. What you might be surprised to hear is that:
If you earn $60,000 a year after taxes and you don’t have kids, you’re in the richest 1 percent of the world’s population.
If you have a household income of $130,000 after taxes with a partner and one kid, you’re also in the richest 1 percent.
If you have a household income of $160,000 after taxes with a partner and two kids. You’re in the 1 percent as well.
Now, think about how you use your resources. Are you making decisions with the planet in mind? How big is your house? How often do you travel? How much do you consume? The wealthier you are, the more likely you are to spend money on items with a large carbon footprint. Every purchase, every journey, every luxury, is part of the footprint we leave behind.
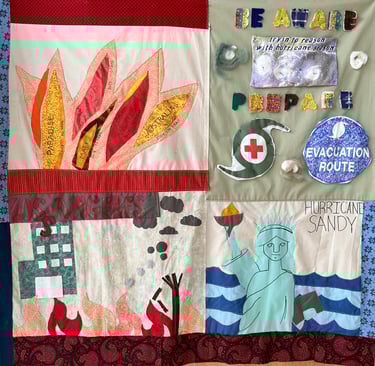
Disasters
Quilt Contributors:
Be Aware and Prepare- Lois Grady-Wesbecher
Hurricane Sandy- Katharine Stirber
Wildfires- Pam Mischen, Lois Grady-Wesbecher, and Karen Jennings-Klaskowski
Los Angeles- Manar Sabry
The Disasters quilt is a stitched chronicle of a world in crisis, a beautiful visual record of the devastating climate disasters that are no longer rare, but routine. Each panel tells a story of lives upended, of communities ravaged, and of a planet increasingly pushed beyond its limits.
Woven through its fibers is the steadfast symbol of the American Red Cross, not as a distant institution but as a lifeline knotted into the chaos. In the aftermath of catastrophe, when the air is thick with smoke or brine and silence follows sirens, the Red Cross arrives with folded blankets, warm meals, and outstretched hands. Their presence is quiet, steady – an anchor amid the disarray, a reminder that even in the darkest hours, compassion can arrive like a light through the rubble.
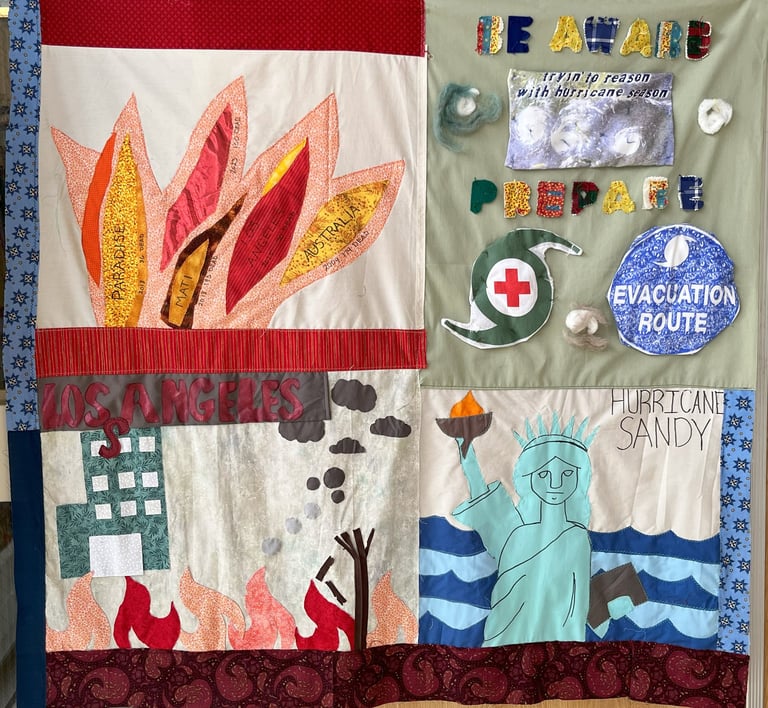
Hurricane Sandy in 2012 was a wake-up call for millions. The Atlantic surged into city streets, subways drowned, lives lost in the dark. For those in New York and New Jersey, Sandy marked the moment climate change moved from headlines to doorsteps. The quilt remembers the water lines left on kitchen walls, the silence of powerless apartments, and the neighbors who carried each other, literally, through the flood. It asks: what do we rebuild when the storm has passed – and how?
Another square pulses with embered reds and bright oranges, conjuring the infernos that have turned Los Angeles hillsides into apocalyptic tableaux. Once rare, these fires now roar with the fury of a planet pushed past its limits. The quilt doesn’t just depict flame – it captures displacement in its rawest form: people standing helpless as their homes are devoured by fire, the frantic exodus down smoke-choked roads, where crashing trees burn like matchsticks and wildlife flees, screaming, into the blaze. It’s a scene of chaos and grief – a burning ocean of fear and flight – stitched into permanence so it won’t be forgotten, or ignored.
Yet amid the devastation, the quilt does something extraordinary – it holds space for resilience. It shows the hands that reach across rubble, the meals shared in shelters, the volunteers who stitch hope into the seams of disaster. These panels are not only elegies; they are calls to action. They urge us to see not just the tragedy, but the pattern: that this is no longer an age of isolated emergencies, but of relentless, interwoven crises. They ask us not just to witness, but to act.
The Disasters quilt, in its beauty and grief, is a mirror held up to our time, an unflinching reflection of a world in crisis unraveling. It insists we reckon with what we’ve lost, and what we can still save.
Biodiversity
Quilt Contributors:
Carla Smith, Schuyler Smith, Allie Morenberg, Matias Oropeza, Katharine Stirber, Fatime Useini, Connie Sternberg, Levi Massar, Sam Massar, Elizabeth, Charlotte Li, Bec Schmitt, Susan Thornton, Ruth Bontrager-Schmitt, L. Fredella, Kelly McCormick, Fiona, Rowan, Jen McCormick, Bryn Pape, Athena Pape, Tye Pacheco, Emily Pape.
Quilt design by Pamela Mischen
The biodiversity quilt was created to highlight the growing threat climate change poses to the diverse species at risk of extinction. Biodiversity means more than the animals we love and the plants we are in awe of; it is the intricate web of life that sustains our planet. It keeps ecosystems in balance, purifies the air we breathe, pollinates the food we eat, and provides the building blocks for medicine and innovation.
But this vital balance is under threat.
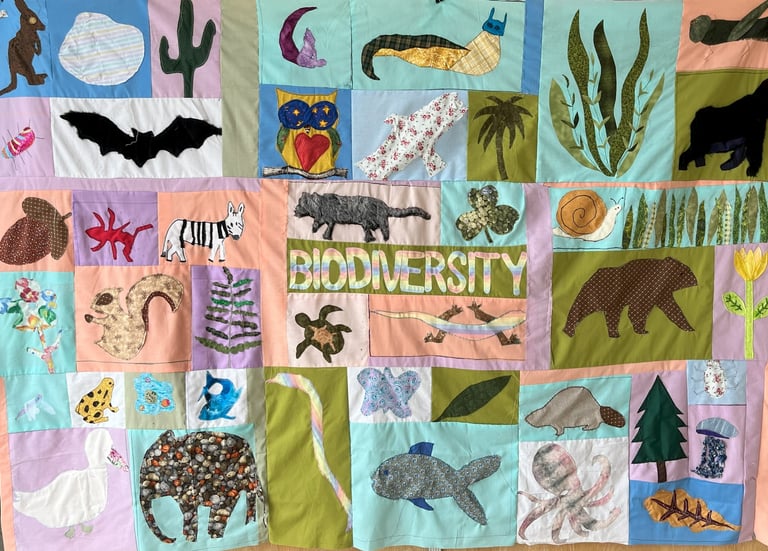
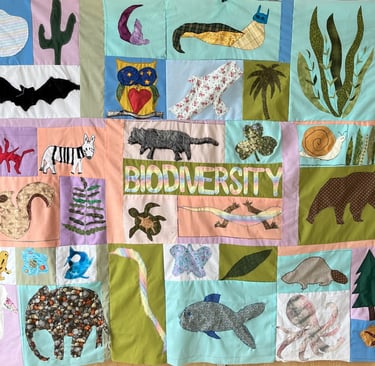
The continuous burning of fossil fuels and widespread deforestation are driving long-term shifts in global weather patterns through the release of greenhouse gasses into the atmosphere. This has led to heat entrapment which is increasing the Earth's overall temperatures at an alarming rate. The risk of species extinction is increasing with every degree of global warming (Biodiversity - our strongest natural defense against climate change | United Nations). At today’s increase of just 1.1°C, around 60 percent of the world’s marine ecosystems are already degraded or are being used unsustainably. If warming reaches 1.5°C, we will lose 70-90% of the world’s coral reefs. At 2°C, we’ll be at a point of no return where nearly 100% of marine ecosystems would be lost.
Rising temperatures, erratic rainfall, and increased frequency of extreme weather events are altering the natural habitats on which countless species rely. Warming oceans are causing widespread coral reefs bleach and death, while forests are experiencing more frequent droughts and wildfires that destroy habitats for many animals. Even small changes in temperature or rainfall can throw food chains off balance, triggering ripple effects throughout ecosystems.
Losing biodiversity doesn’t just mean fewer animals or plants; it threatens the stability of the systems that keep our planet livable. Protecting biodiversity is about protecting the natural foundation that supports all life, including our own.
This quilt was constructed during community quilting sessions as Roberson Museum and involved the young and old alike. This age range shows that our concern for our fellow inhabitants of the Earth spans generations.
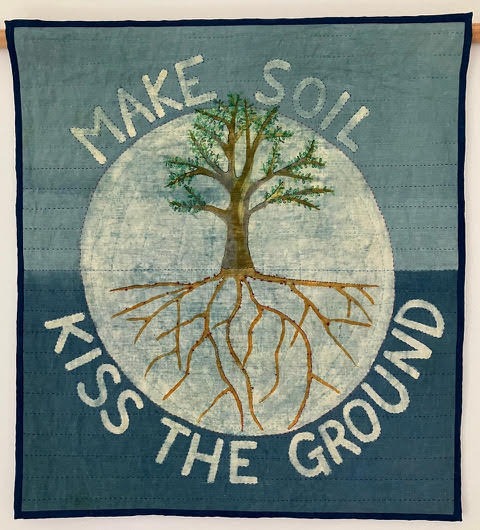
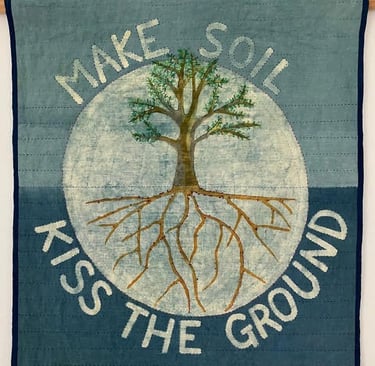
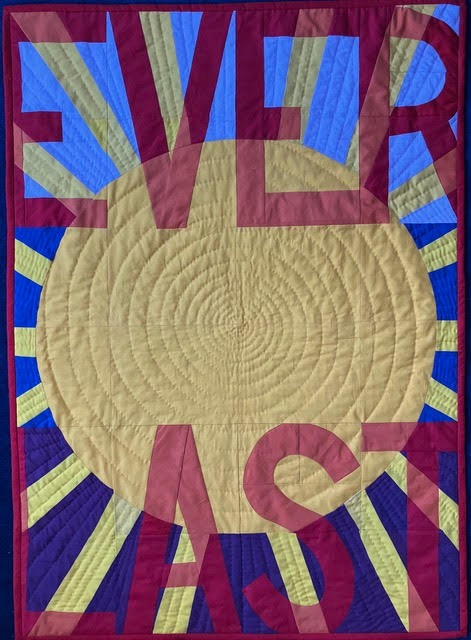
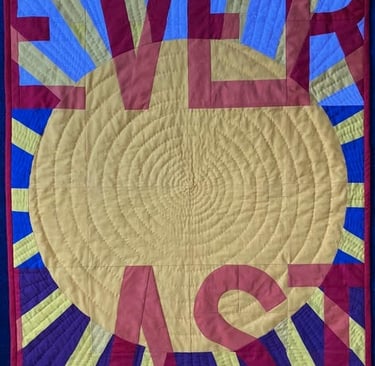
It’s Not Easy Being Green
Quilt design by Pamela Mischen
Despite the magnitude of the climate change issue, everyone has the ability to lower their carbon footprint. People often cite cost as one of the reasons that they don’t live more sustainably. However, iIf we take sustainability seriously, our focus should be on reducing consumption. The greenest energy is the energy we don’t use; the greenest products, the ones we don’t buy. And here’s the great part-- reducing consumption saves money! Additionally, Americans use renewable resources five times faster than the Earth can renew them. So reducing consumption not only reduces your carbon footprint, it also preserves habitats.
This quilt focuses on some of the easy things you can do to live a more sustainable lifestyle. You will notice that many of the recommendations focus on reducing consumption, from not keeping up with the latest trends, to saving energy by unplugging sources of vampire energy, and swapping unused items with others who also have unused items. It also focuses on ways to change our consumption habits to be more sustainable like buying thrifted clothes and eating more plant-based proteins. It suggests sustainable ways of
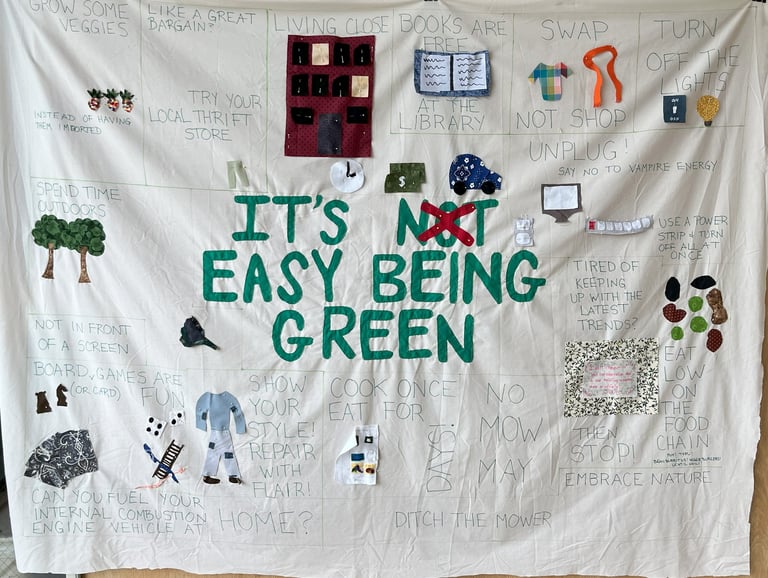
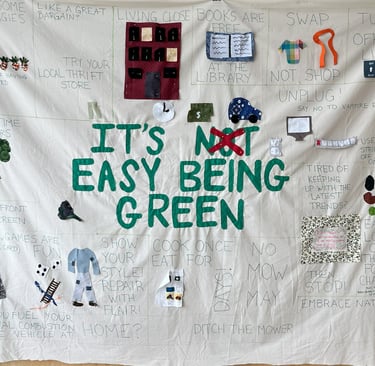
spending our time such as playing board games with friends, enjoying the outdoors, and growing some vegetables. Finally, it tackles some of the bigger contributing factors to our carbon footprint by emphasizing their easy aspects such as being able to charge an electric vehicle at home rather than making a special trip to a gas station or living close to where you work to avoid the need for a car altogether.
Living a sustainable lifestyle can be one full of richness, not of deprivation.
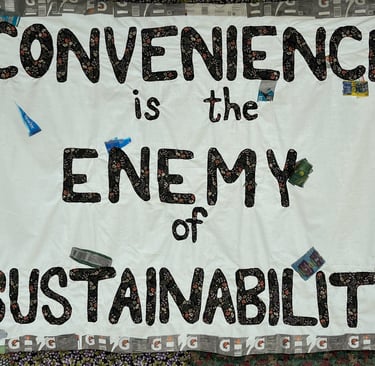
Convenience is the Enemy of Sustainability
Quilt design by Pamela Mischen
Quilt sewn by Natalie Kachmarik
Plastic collected by the B-Upcycle Project
Do you ever stop to think how the promise of “just grab and go” turns our landscapes into floating trash heaps?
One million plastic bottles are purchased every minute, and globally, only 9 percent of that waste gets recycled, while 22 percent is mismanaged. We often think of plastic waste as something we can neatly bag and bin, but in nature, it refuses to stay contained. As a society, we continue to prioritize the convenience of single-use plastics and flawed recycling systems while actively ignoring the responsibilities and consequences that come with them.
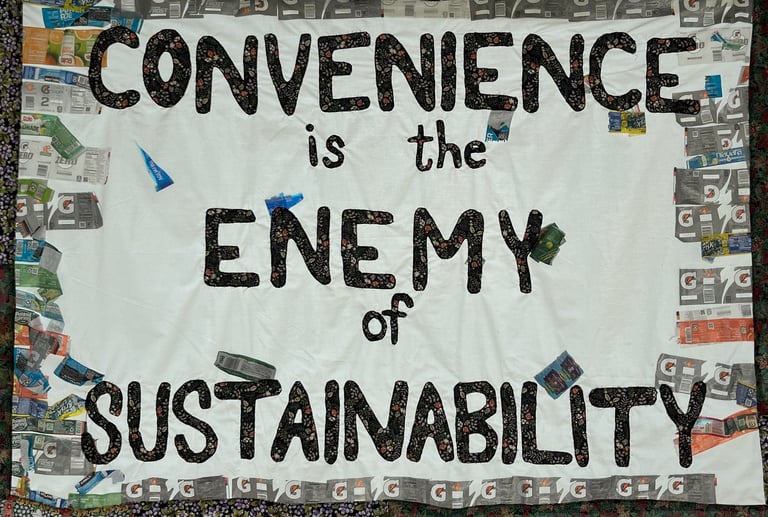
This quilt represents the debris that enters ecosystems each day. Ghost nets—once convenient tools of the fishing industry—now drift through oceans, strangling marine life by the ton. Our rivers swell with brightly colored packaging designed to “make life easier,” now breaking down into microplastics that end up in the stomachs of fish, birds, and even us.
Each element in this quilt serves as a memory of what we discard—plastic fragments, bottle caps, food wrappers—stitched together to confront us with the truth: that “away” is not a place, but a delusion. These discarded bits of convenience don’t vanish; they travel, entangle, and persist.
Reject the throw-away wrapper. Refuse the single-use bottle sleeve. Demand refillable, returnable, regenerative solutions instead. Because convenience should never come at the cost of a living planet.
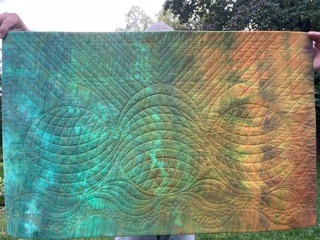
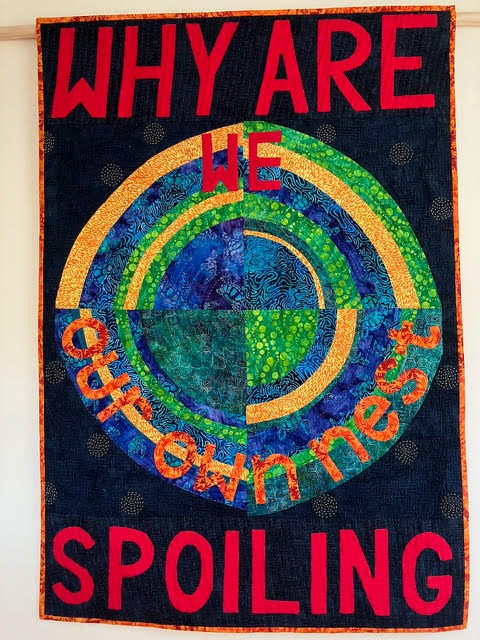
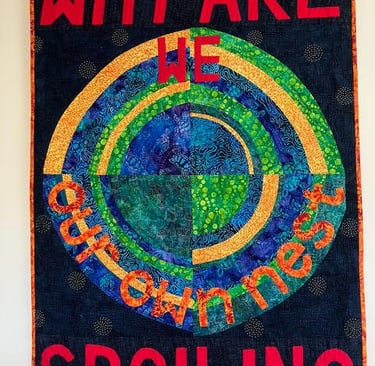
Climate Change Lament or Hope
Music composed by Charlene Thomson. Performed by Charlene Thomson (piano), Kim Patch (violin) and Eric Smalley (bass).
Music quilt by Charlene Thomson
Hope quilt by Pamela Mischen with help from Laurie Kern.
This pair of quilts and the music playing reflect the emotions triggered by climate change, but they also represent a choice that we have. We will look back and lament our choices, our losses, our tragedies? Or can we have hope for the future? Hope that we will recognize that we are all connected and cherish those connections?
The Hope Quilt was inspired by my academic research on complex adaptive systems using social network analysis. Each circle (node) represents a person, species, organization, or element; each line represents a connection between them.
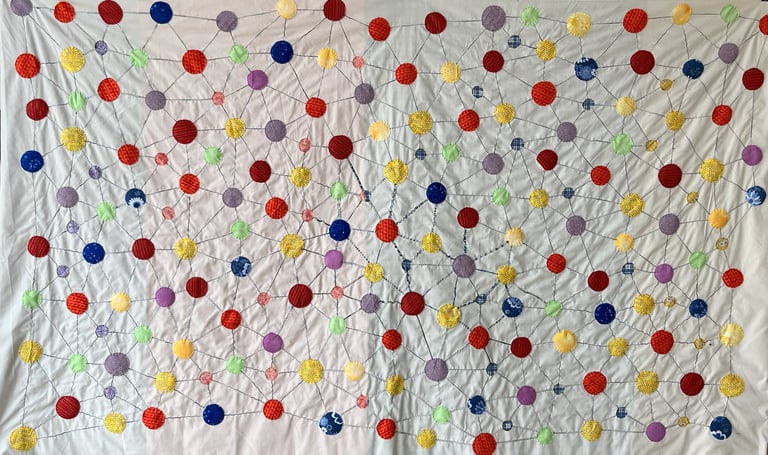
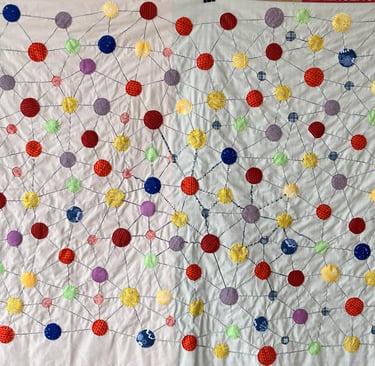
We are connected in many different ways, as represented by the different forms of stitching. We come from many different backgrounds, as represented by the four different background colors. Some of the circles are cutouts, representing the different layers of our ecosystems- many of the species that contribute to the circle of life are found beneath the soil surface. Finally, the connections form a series of triangles. In social networks, triangles represent closed triads where all three nodes are connected to each other. They indicate a high degree of clustering and interconnectedness within a group, suggesting a strong, cohesive community.
Let’s work together, with hope for our collective future.
-Pamela Mischen
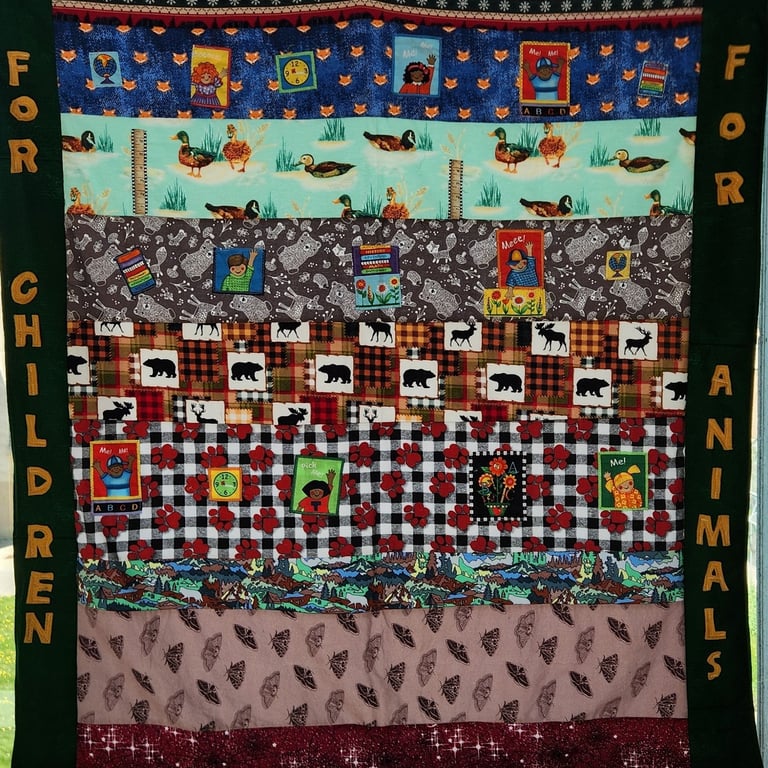
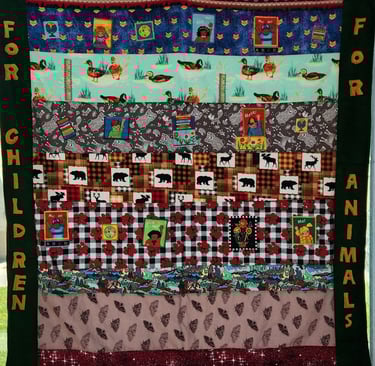
Do It for the Kids/Animals
Victoria Londner
This quilt was first made from a desire not to waste material. It is made from the remnants of fabric used to make burp cloths for babies. Children and animals became the theme for the quilt. Plants, animals, and the natural world support life; our life on this planet. We need to take care of the planet for the children and other creatures that share our living world. Teaching children to care for our world is an important part of a sustainable future.
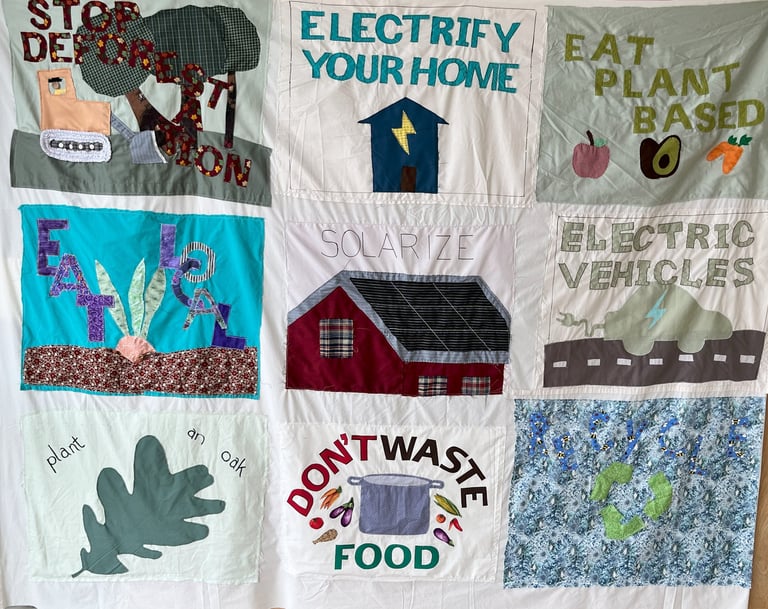
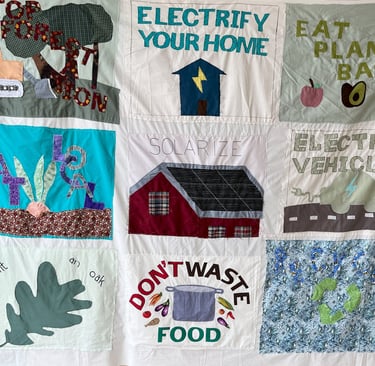
Solutions
Quilt contributors:
Stop Deforestation- Natalie Kachmarik
Solarize- Pamela Mischen
Eat Local- Pax Zissler
Eat Plant-Based- Jamie McManmon
Plant an Oak- Robyn Cope and Erin Gordon
Electrify your home- Katharine Stirber
Electric vehicles- Alyssa Weber
Recycle- Juliahmar Rodriguez and Katherine Quinones
Don’t Waste Food- Michael Gersten and Linda Mischen
Human beings, and all living things on planet Earth, have adapted to significant climatic changes throughout history. However, the pace of climate change in this modern era is accelerating so rapidly that plants, animals, and even humans are struggling to adapt. However, all hope is not lost for the planet just yet – there are still solutions, and we have the tools we need.
Solutions to climate change come in two main categories: mitigation and adaptation. Mitigation strategies involve reducing the amount of greenhouse gases we release into the atmosphere today, to prevent further warming in the future. Some level of global warming is inevitable considering the amount of greenhouse gases already in the atmosphere. To save as much life as possible, we must adapt.
Though climate change is a global issue, many solutions must begin at the local level. That means that you have the power to take direct action today to combat this threat – for ourselves, for our children, and for future generations.
There are dozens of potential solutions to climate change, and creative minds are developing new ones all the time. The solutions highlighted in this quilt represent some of the most impactful steps we can take:
Transitioning to renewable energy: Renewables, like wind and solar, generate electricity without emitting carbon. Choosing them over fossil fuels helps power our world without fueling the crisis. Consider installing solar panels on your roof and a heat pump in your home to reduce reliance on fossil fuels.
Stopping deforestation: Trees are crucial in combating climate change. They absorb carbon from the atmosphere, helping to mitigate warming. They also provide vital habitats for countless species.
Afforestation (planting more trees): Look for tree-planting events near you or consider donating to charities that plant trees around the world.
Recycling: This helps us repurpose materials we’ve already extracted from the Earth, conserving valuable resources and reducing waste, and saving resources for future generations.
Changing eating habits, like eating local: Eat more plant-based food to lower your carbon footprint and support local agriculture. Visit your local farmer’s market, or better yet, grow your own food if you can!
Every action counts. By making every conscious choice today, we can help protect this planet we call home — for us and our children and grandchildren. Together, we can act before it’s too late.
For more information on what you can do, visit:
https://climate.nasa.gov/solutions/adaptation_mitigation/
https://www.un.org/en/actnow/ten-actions
https://www.nrdc.org/stories/how-you-can-stop-global-warming
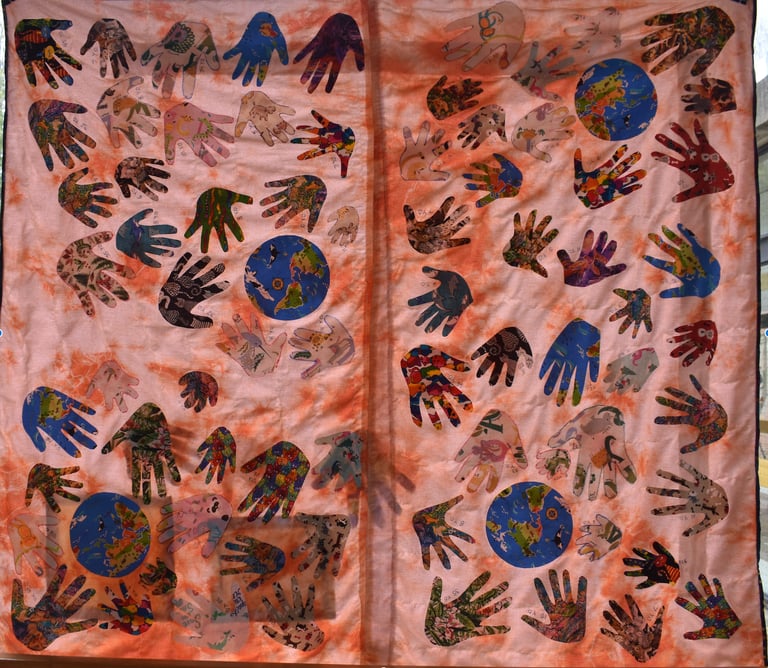
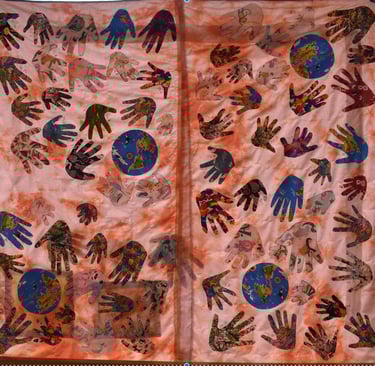
Kids Handprints #1 and #2
UHS Peds, Binghamton --- We recognize that what we do or don't do now matters in the short term and long term. This impact can be felt by all of us, including those who have no voice --- our kids. Dr Mary DeGuardi and her staff asked their pediatric patients and caregivers to draw their handprint and list their favorite animal or nature theme. You'll see their hands encircle our globe, and we tried to keep a family's handprints together. Some animals are easy to find --- dogs and cats were the most popular animal chosen. Other animals are more camouflaged but still present, if you know where to look. You'll notice we only list ages with our handprints --- for privacy purposes. Our smallest handprints are from our babies who will one day inherit this earth. We fused our handprints onto a hospital sheet tie dyed by the Pediatric Social Worker, Lisa Castetter. Quilt made by Dianne Wessell, Sarah Dobler, Steven Button, and Lisa Castetter. Additional assistance provided by Tammy Burger & Margo Martino (fabric donations), as well as Colleen Bronson & Idasa Tariq (design & layout).
Our hospital system has a variety of programs throughout our region, including a health clinic based within the Benjamin Franklin Elementary School in Binghamton. This is the second of our Kids' quilts. Staff at the clinic site asked students if they wanted to be a part of our Earth Day quilt. If so, they drew their handprints onto a piece of paper and wrote their age and favorite animal. In just 1 1/2 months, staff collected 70+ handprints, and we fused those onto animal/ nature themed fabrics. Our hands encircle our globe, and you'll spot many recognizable animals. Dogs and cats were the most frequently chosen, but if you look closely, you'll see other animals from our land, sea, and sky.
Our handprints are fused onto a hospital sheet tie dyed by Lisa Castetter, the Binghamton Peds Pediatric Social Worker. Who knew a hospital linen could be so colorful! Quilt made by Dianne Wessell, Sarah Dobler, and Steven Button. Additional help from Margo Martino and Tammy Burger (fabric donations) and Colleen Bronson and Idasa Tariq (design and layout). Special thanks to the staff at Franklin's School Based Clinic as well as UHS Pediatric Clinic, Binghamton for all their legwork and support. Kudos to Dr Mary DeGuardi for leading the way!
-Dianne Wessell
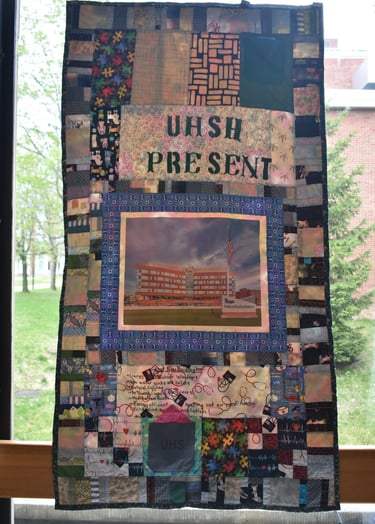
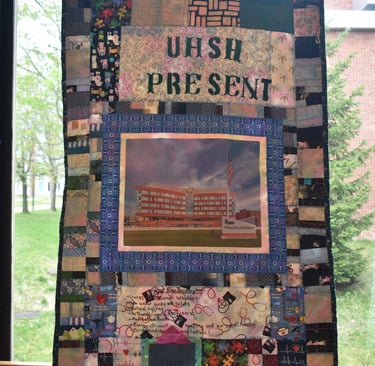
UHSH Present
UHSH opened a new building in 2024. This quilt describes the energy efficiency and innovative ideas that were built into the design to enhance patient healing, while promoting energy efficiency.
Quilt by Terri Peters
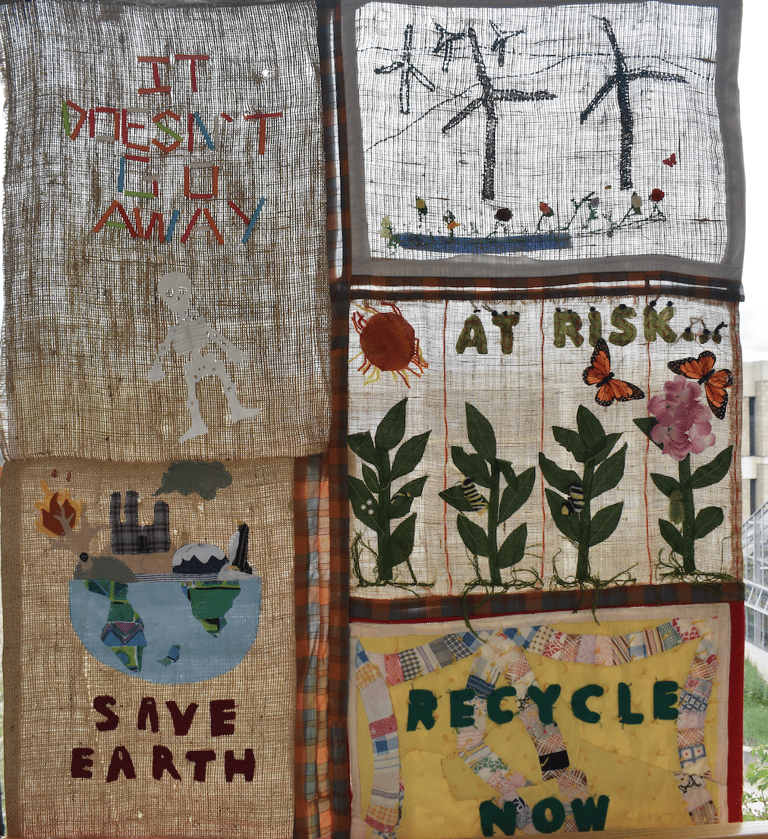
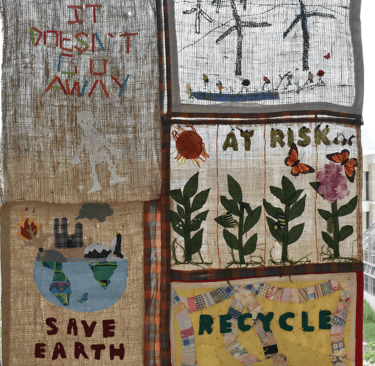
Coffee Sack Quilt
Quilt Contributors:
Save the Earth- Prawravee Pothiwit
Monarchs- Karen Jennings-Klaskowski
Recycle Now- Lois Grady-Wesbecher
Wind Power- Annelise Heurich
It Doesn’t Go Away- Natalie Kachmarik
This quilt, crafted from repurposed coffee sacks, is a striking example of creativity, sustainability, and personal expression woven together. By using old jute and burlap coffee bags—materials often discarded after use—the creators found a way to honor the values of reuse and waste reduction, which are essential in the fight against climate change. The rough, textured fabric carries traces of its past life: faded logos, shipping stamps, and worn fibers that speak to global trade, agriculture, and the human hands that harvest coffee across climate-vulnerable regions.
Each square in this quilt is a personal reaction to climate change—some hopeful, others heavy with concern. The use of coffee sacks is particularly meaningful, as coffee is one of the many crops already being affected by rising temperatures, unpredictable rainfall, and shifting growing zones. In this way, the medium becomes part of the message: climate change is not abstract—it touches what we eat, drink, and depend on.
This quilt challenges us to rethink what we throw away and what we value. It’s a tactile reminder that sustainable solutions can be beautiful, expressive, and deeply personal. Through its patchwork of reimagined materials and heartfelt messages, it invites us to take part in the story of climate action, starting with the choices we make every day.

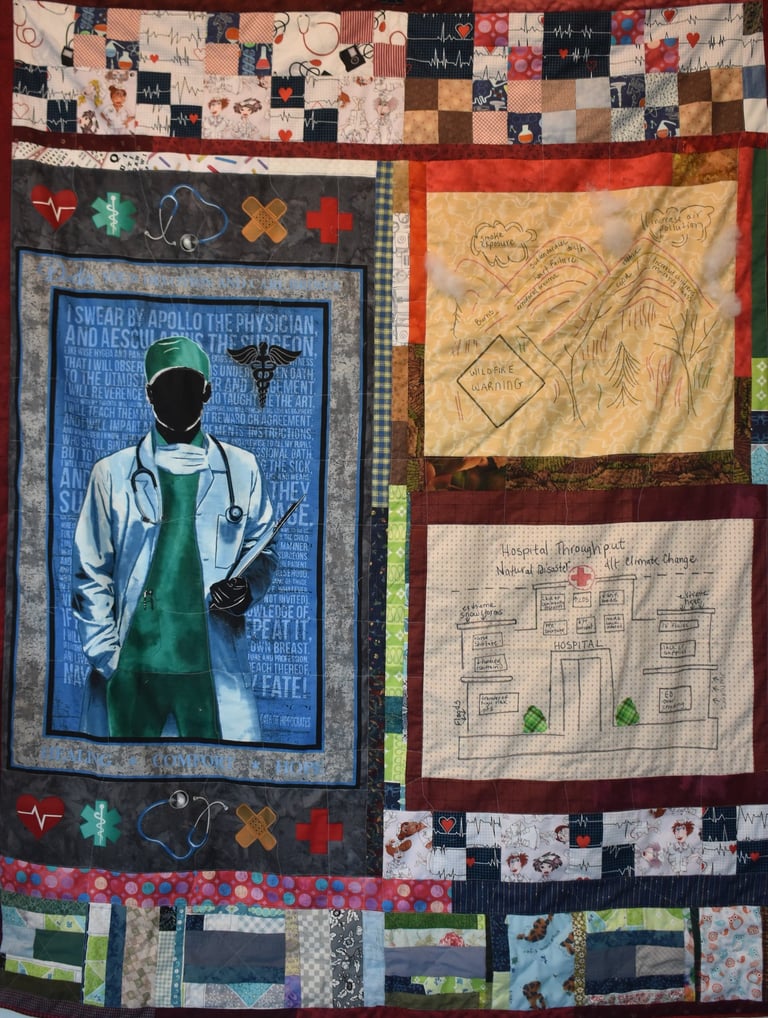
Medical Quilt #1
This is the 1st of what I call our Medical Quilts --- looking at climate change through the lens of how it impacts our patients, families, and what we do in a medical setting. Our goal was to make these colorful and engaging enough that you would get a visual from afar and want to come up and take a closer look. The first medical quilt showcases 2 panels designed and made by a non quilter --- Colleen Bronson, RN, a CCU/ ICU Case Manager. The top panel highlights our recent issues with Canadian wildfires, and how those events triggered medical issues, including respiratory and cardiac concerns. The second panel "Hospital Throughput", features a multitude of climate change issues, detailing so many ways these can impact us in our setting. NOTE: If it impacts us, it impacts patients and families. This isn't about convenience. If you take the time to look at the details found in both panels, they're striking and thorough, showing how climate events impact us on both a macro and micro level. To that we added some traditional quilt blocks, not all of which are made with traditional quilt fabrics. The top fabrics include "novelty prints" --- quilting fabrics with a medical theme (nursing, chemistry & formulations, EKGs, etc). The bottom blocks include "string" blocks made with traditional fabrics and deconstructed hospital gowns, linens, and scrubs. I'll be honest --- we needed to add the traditional fabric since the hospital items were too worn and nontraditional to behave as we needed them to. As you can tell from these two quilts, we didn't really follow the instructions for panel size when making our quilts. No, we made life more challenging for ourselves by giving staff permission to construct their individual pieces in whatever size worked for them. We then had to piece things together as we got them, seeing what fit together, literally and figuratively. We were grateful for the commitment of staff to this project, and what came from that obviously grew past our original expectations.
-Dianne Wessell
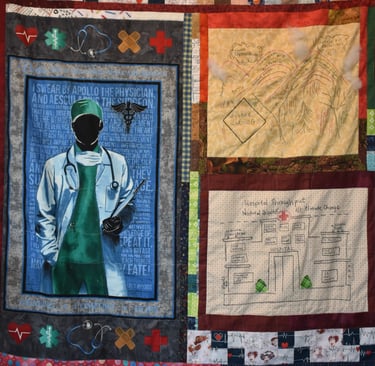
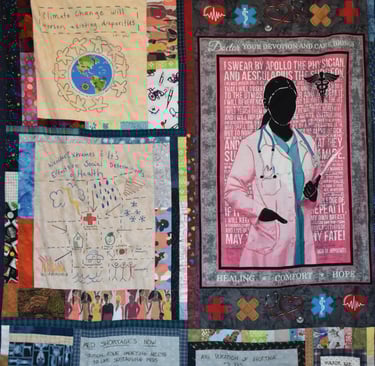
Medical Quilt #2
Similar to the Medical Quilt #1, there is a faceless doctor facing you. Sorry, but traditional fabric makers gender stereotype, using pink/ blue, female/ male; the medical icons worked so we went with them. Please excuse if this offends. In this quilt, Colleen Bronson, an RN Case Manager in our ICU/ CCU, designed 2 more quilt panels. The top panel references the CDC's statement that "Climate change will worsen existing disparities". That panel has fabric around it which reflects some of those disparities (race/ age/ poverty/ etc). The bottom panel focuses on a theme common in the medical field ---"social determinants of health". Again, we strategically chose fabrics to carry that theme around the panel. The two panels in this piece relate to the two panels found in our 1st medical quilt. We had other staff adding input as well, including --- at the top --- fabric photos done by Terri Peters, RN, UHSH Research Program Mgr. There are pictures of Canadian Wildfires on the left, and on the right, how that smoke wreaked such local havoc this past summer through fall. At the bottom --- --- info on medication shortages we've faced due to tornadoes and hurricanes. NOTE: These are just the most recent shortages. A government study recommended the pharmaceuticals consider having more than one plant in more than one region to mitigate this concern AS IT ONGOING. To date that hasn't occurred. Future shortages, including more life sustaining meds, are expected to continue. Since the average duration of a shortage can be three years or more, this is VERY concerning. Folks who helped collaborate in these quilts who were not yet identified include: -Valeda Chaszar RN, Case Management, - Tammy Jo Race, Case Management - Karen Stump, CM - Kim Walling, BGH Labs - Sara Kasper All photos in our quilts were done with the AMAZING participation of Joe Gaube, a local retiree who used to own The Instant Face Place. Even though he could have politely declined to participate, he worked with us under less than ideal circumstances, and helped direct us as needed.
-Dianne Wessell
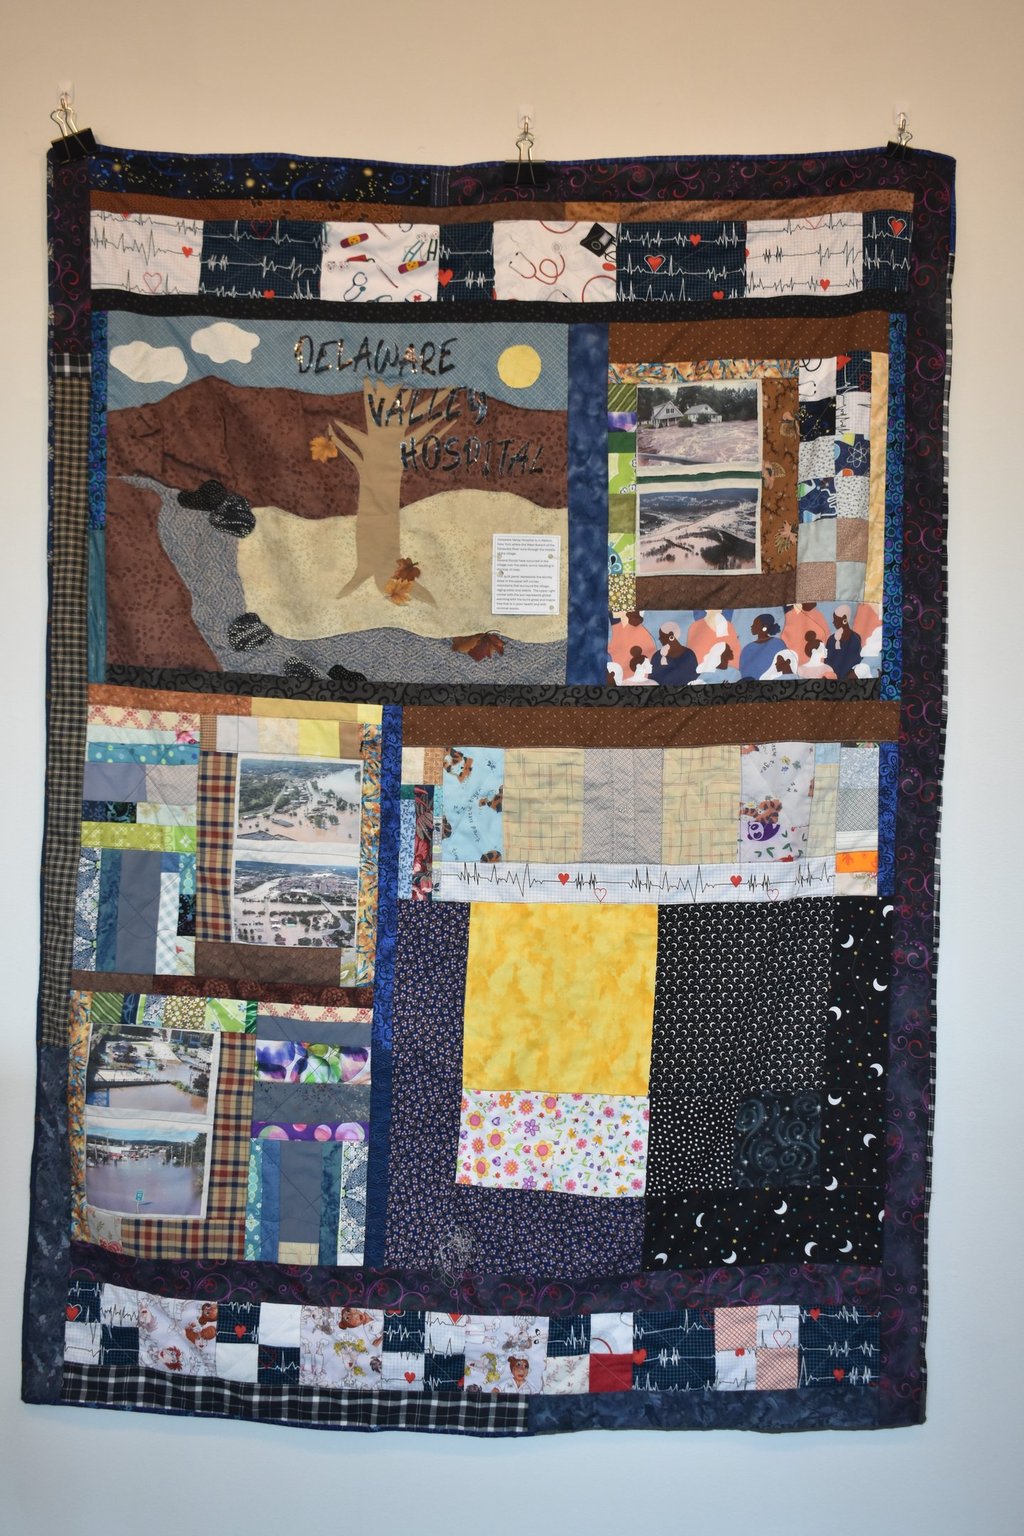
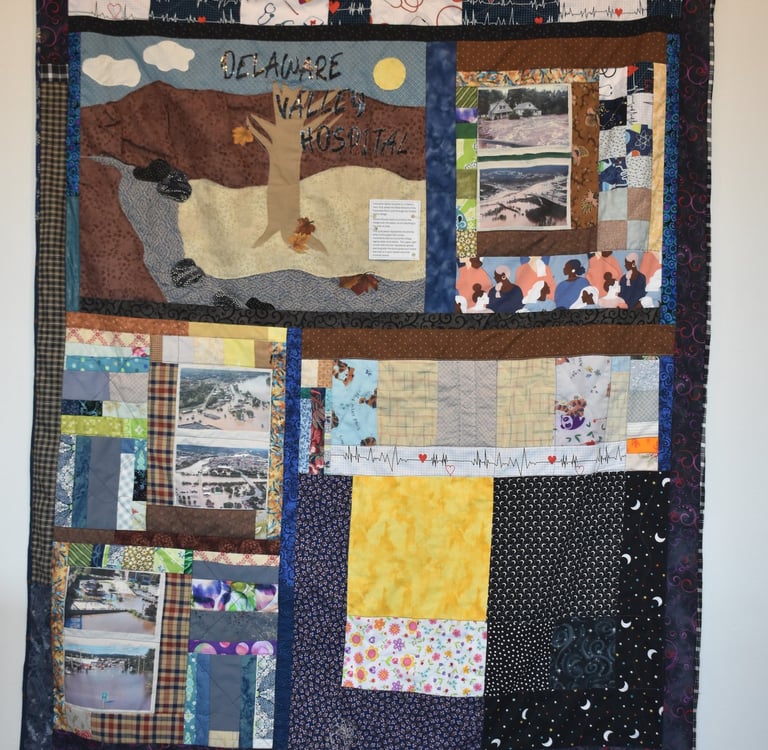
Medical Quilt #3
This is the third of our medical quilts, and you'll notice the flood theme repeats here. The flood pictures are from Terri Peters, which were printed onto fabric by Joe Gaube, Instant Face Place. They show how this area was impacted by floods --- taken with the "Flood quilt", they're a reminder of how our area can be devastated in a matter of hours. Terri's pictures show how weather extremes don't just happen elsewhere. The quilt panel that appears mid quilt was made by a UHS retiree, Margo Martino, featuring our environment in fabric form --- the night sky, our moon, the galaxy, and snow in the night sky. The bright yellow represents light and hope, with the floral fabrics representing our earth and its bounty. Margo is an avid gardener and this panel is a reminder of how weather patterns have a strong impact locally and globally. At the top of the quilt is a panel made by Delaware Valley Hospital. It is dimensional and tells the story of extreme weather as seen in one of our rural communities --- "Delaware Valley Hospital is in Walton, New York where the West Branch of the Delaware River runs through the middle of the village. Several floods have occurred in the village over the years, some resulting in the loss of lives. The quilt panel represents the stormy skies in the upper left corner, mountains that surround the village, raging water and debris. The upper right corner with the sun represents global warming with the burnt grass and maple tree that is in poor health and with minimal leaves." Our hospital system encompasses inpatient and outpatient services in multiple counties, and our patients, families and staff live and work in these communities. Parts of our community are still struggling to rebuild years after extreme weather --- floods especially --- have ravaged our landscape.
-Dianne Wessell
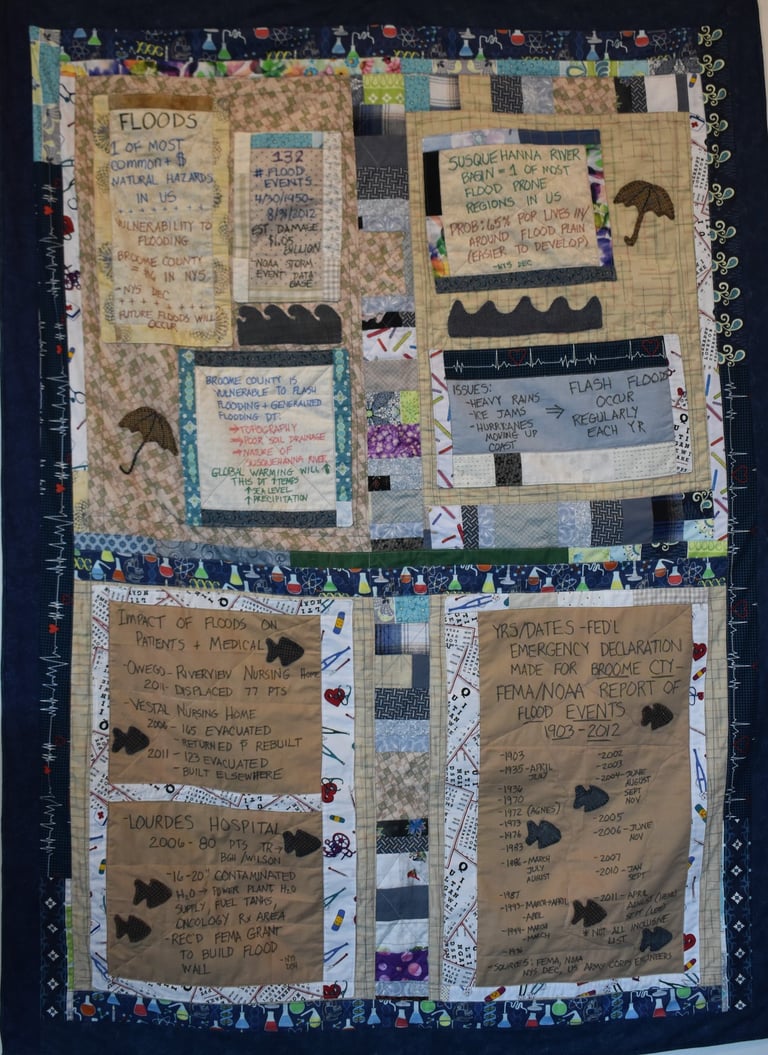
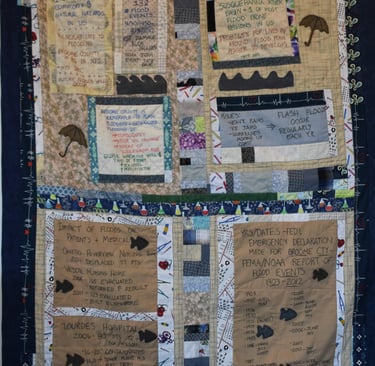
Floods
This is the first of the UHSH quilts, and that's no accident. If you think about natural disasters in our area, it's all about floods. Some think about the most devastating floods in recent history --- 2006 and 2011 --- a 100 year event and a 500 year event occurring in such a short time span. Others may reference the flooding that came with Hurricane Agnes (1972). In all cases, the impact to our communities --- our patients, families, staff, and services was significant. In doing research for this quilt, I discovered that our area is known for flooding, that these were NOT aberrations. In fact, the indigenous people referenced regular flooding, which research corroborates. What started out to be a panel or two turned into a full quilt. It had to be, since local governmental bodies recognized future floods will continue to occur, exacerbated by climate change. They developed plans to try to mitigate the catastrophic consequences --- to families, businesses, the community, the infrastructure, and the tax base. All this info is easily accessible and validated by local, state, and federal agencies. Not exactly alarmist entities. This quilt uses hospital gowns, scrubs, and linens in addition to traditional quilting fabric. The "batting" is a hospital cotton blanket, added to support the weight of the quilt. The backing is a hospital sheet. There's also recycled/ upcycled wool from men's & women's business attire and recycled flannel from clothing. The strip piecing connecting the panels is called "string quilting", which uses scraps and strips from both the recycled hospital fabrics and the quilt fabrics on a lightweight foundation to stabilize them. If you think hospital gowns are hard to wear as a patient, they're even harder to work with in a quilt. All quilters have a stash of fabric and I'm no exception. I did ask for help from my sewing and quilting friends and they helped supply some of the fabrics in this quilt, including some of the fabrics with medical icons (the eye chart, the fabric with the wheelchair & the crutches). I wanted you to have a visual from afar, and detail on closer examination.
-Dianne Wessell
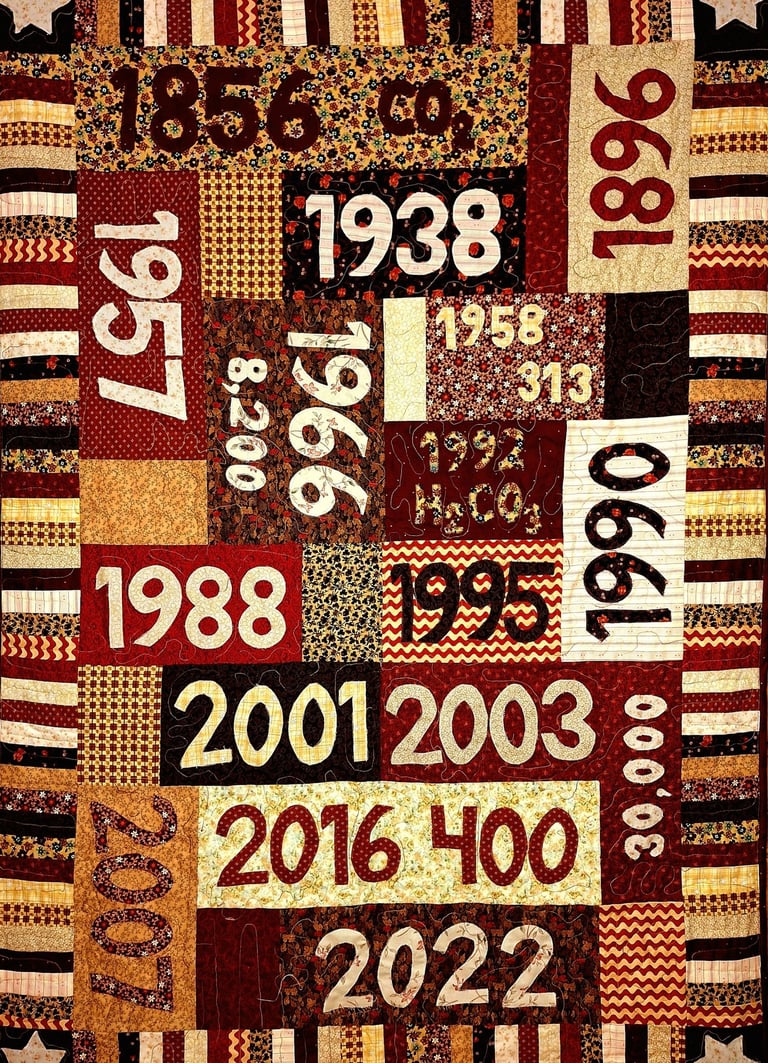
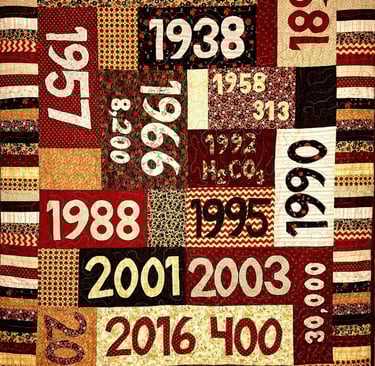
We Can't Say We Weren't Warned
Designed by: Pamela A. Mischen
Created by: Pamela A. Mischen, Roberta Brown
The dates on this correspond to important dates in the history of climate science. You can learn more at: https://scied.ucar.edu/learning-zone/how-climate-works/history-climate-science-research
1856- Eunice Foote discovers that CO2 acts as a greenhouse gas
1896-Swedish chemist Svante Arrhenius recognizes that burning coal could increase CO2 and warm the climate
1938- connection made by British coal@engineer George Callendar that CO2 and temperatures were rising together
1957- Roger Revelle and Hand Suess realized that CO2 from industrial sources was building up in the atmosphere
1958- Charles Keeling started making daily measurements of CO2 at Mauna Loa
1966- in Greenland, an ice core that reveled 8,200 years of climate was extracted
1988- NASA scientist James Hansen testified before the Senate Energy and Natural Resources Committee stating that climate was warming, greenhouse gases are responsible for the warming, and humans are responsible for the growth in these gases. That same year, the Intergovernmental Panel on Climate Change (IPCC) was formed.
1990- the first IPCC report states “human activities are substantially increasing the atmospheric concentrations of greenhouse gases.”
1992- Stephen V. Smith and R. W. Buddemeier made the connection between increasing CO2 in the atmosphere and increasing acidity of the oceans leading to damage of coral reefs
1995- second IPCC report stated “The balance of evidence suggests a discernible human influence on global climate.” This led to the development of the Kyoto Protocol.
2001- the third IPCC assessment report stated, “there is new and stronger evidence that most of the warming over the last 50 years is attributable to human activities.”
2003- a heat wave in Europe linked to climate change resulted in more than 30,000 deaths
2007- the Fourth IPCC Assessment Report states, “Warming of the climate system is unequivocal.”
2016- CO2 concentrations in the atmosphere reach 400 ppm (up from 313 in 1958)
2022- the Sixth IPCC Assessment Report highlighted the current impacts of human-induced climate change. The changes have caused widespread adverse impacts and damages to nature and people, beyond what would be expected by natural variability.
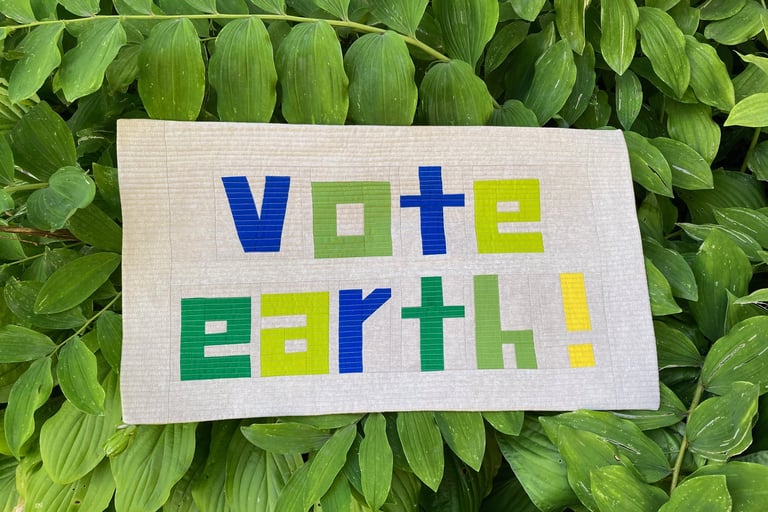
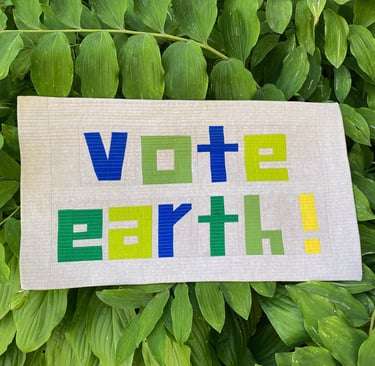
Vote Earth
Designed and Created by Kristen Andrews
I've realized one of the most impactful things a person can do is to elect politicians who will make the necessary laws, incentives and system change to rapidly implement climate solutions. I hope this 16”X24" quilt sparks discussion and action.
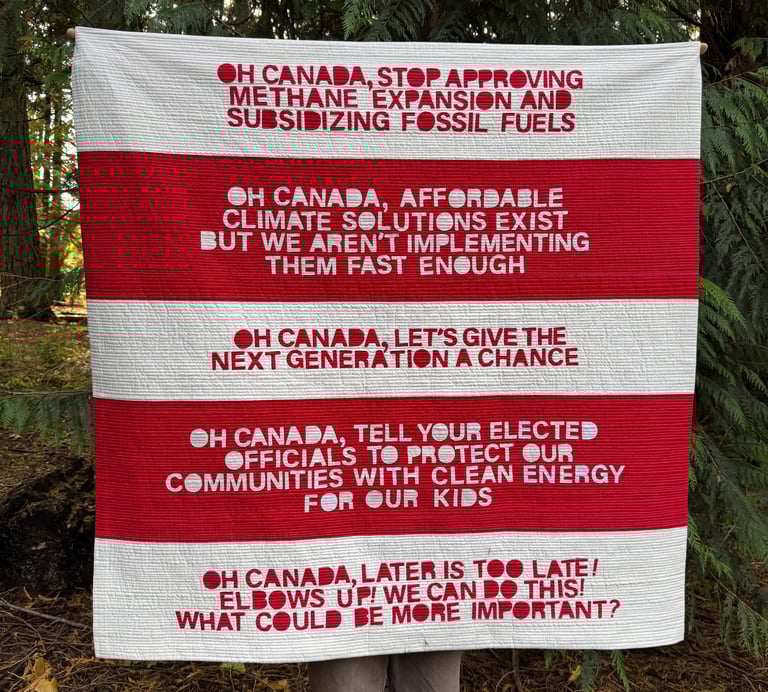
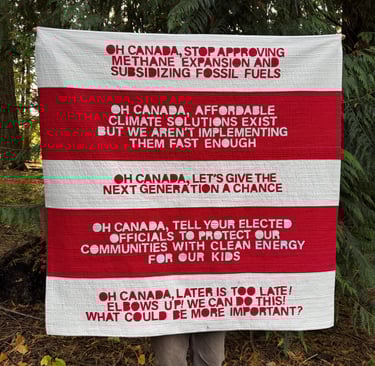
Oh Canada
Designed and created by Kristen Andrews, Vancouver, British Colombia
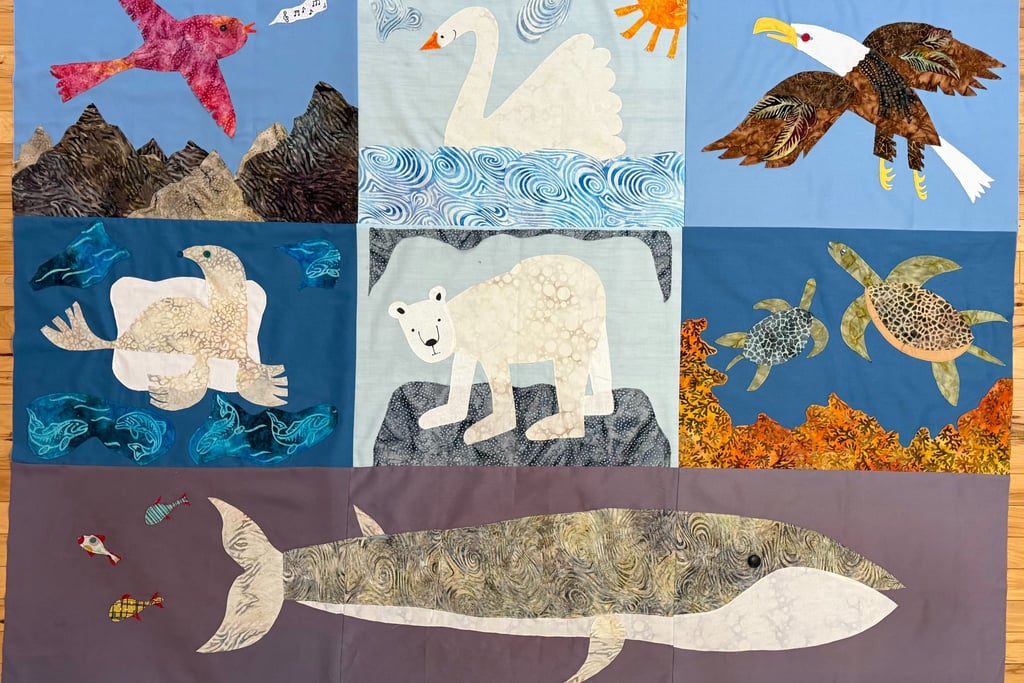
Swan Song
By Carolyn Berge
My quilt all started with a “swan song”--- an English madrigal that I sang many years ago. In the lyrics, the swan, mute until the last of her life, finally spoke her words of wisdom and warning. The song reflects the hopelessness that many of us feel today, especially when it comes to climate change. When humans feel hopeless, it is productive to focus on positive acts---to do or say something meaningful and to share those thoughts with others. This quilt project has given us a chance to speak in a visual, communal way. The exhibit will benefit the creators and also those who view our quilts, hopefully finding beauty and purpose in our efforts.
So, the swan took the center stage of my quilt and other animals of water and sky joined in. I took inspiration from the famous children’s book author and illustrator, Eric Carle and relied on my artistic daughter, Rachael, to refine my templates. These are seven animals that have issues with migration patterns, rising water temperatures, food scarcity and pollution, but. . .
Climate Change affects ALL creatures Great and Small.
The Silver Swan
English Madrigal
BY ORLANDO GIBBONS
The silver swan, who living had no note, When death approached, unlocked her silent throat; Leaning her breast against the reedy shore, Thus sung her first and last, and sung no more: “Farewell, all joys; Oh death, come close mine eyes; More geese than swans now live, more fools than wise.”
Quilts finished/submitted in 2025

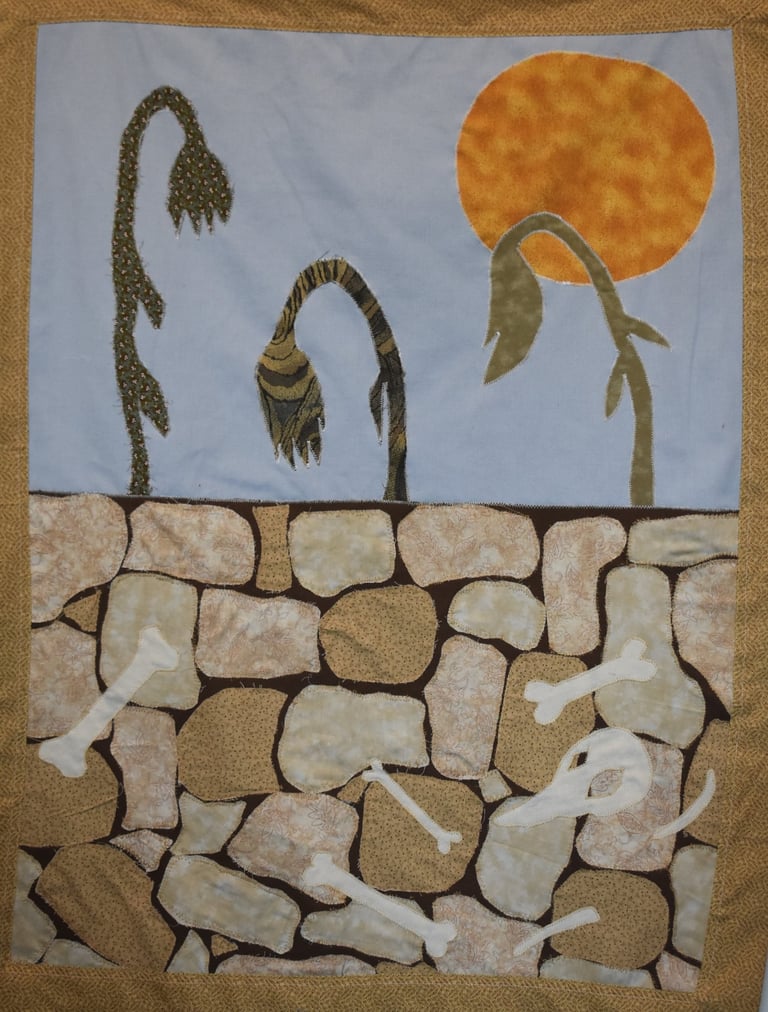
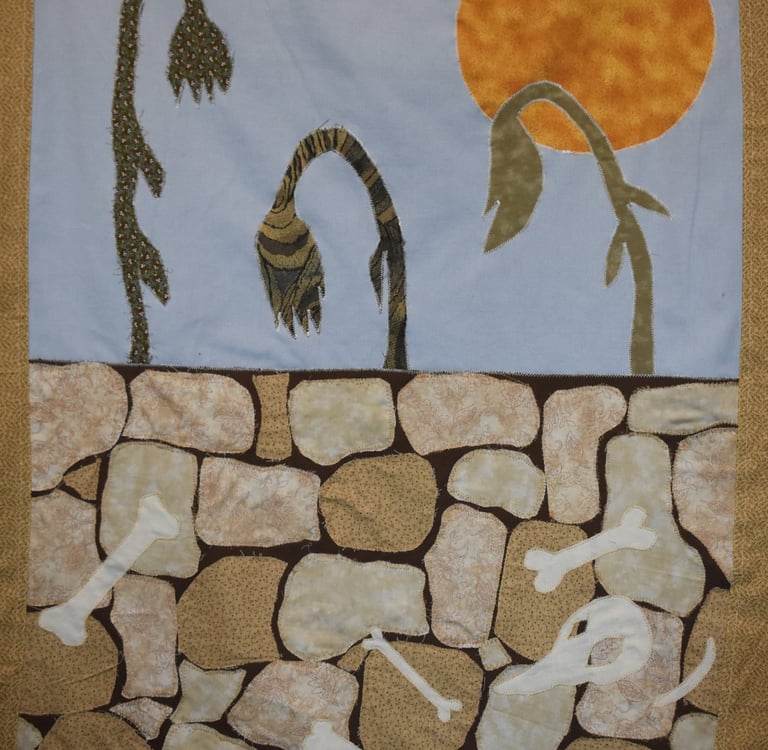
A Swiftly Dying Planet
Created by Sandra Schott
It is 22" x 35”. Hand dyed with Pro MX fiber reactive dye on cotton - one piece and custom quilted with cotton thread. The quilt represents the unfortunate stages that the earth is taking due to climate change. From lush fertile greens, browns and blues to baked clay brown, orange and a disappearing blue/green - a planet ready to disintegrate.
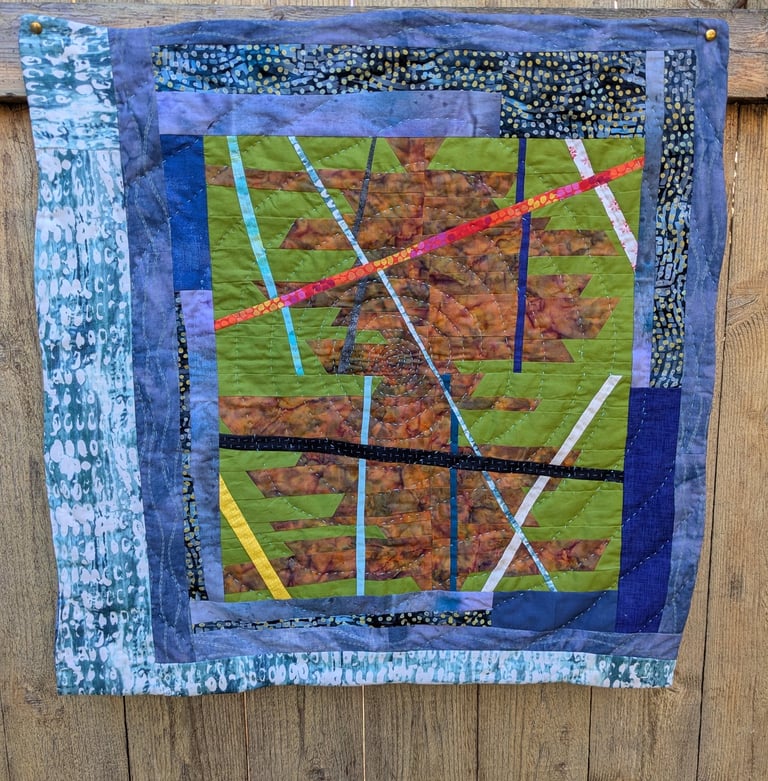
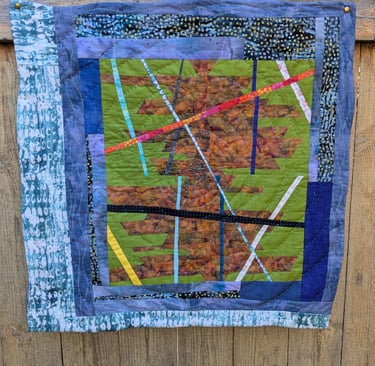
Fever on the Bayou
Created by Jennifer Boyer
I started this quilt in August 2021, just as a fire was ravaging the mountains west of where I live. Having spent my whole life in the American West, I am all too familiar with wildfires. As ash rained down on our house, I once again thought about just how much climate change has changed the planet in my lifetime. And how each of us is affected in different ways. This quilt, although created during a localized event, depicts another climate disaster - the loss of the wetlands in South Louisiana. The loss of the wetlands in Louisiana has many local and global consequences, such as catastrophic flooding during hurricanes. The quilt is named “Fever for the Bayou” after a song by the awesome blues rocker, Tab Benoit from Houma, Louisiana. The intersecting lines on the piece all represent different facets of this geography - from industry (oil and seafood), to musical notes representing the robust Cajun musical tradition. I hand quilted the top to appear like a raindrop rippling out in a puddle, however upon completion I realized that it also looked somewhat like a target. An unintentional, yet meaningful depiction as well.
Climate change where I live looks different than where you are. This photo was taken in the Rattlesnake Creek burn area to represent what climate change is where I reside. And as I write this statement, our state is inundated with devastating flooding from an atmospheric river. Areas a mere mile from my house are flooded. Watching the dismantling of so many decades-long climate change initiatives over the last year has been heartbreaking. It often feels hopeless but now is when our action is needed more than ever.
Quilts finished/submitted in 2026
Kate Warner
Kate Warner
Kate Warner
Kate Warner
Kate Warner
Kate Warner
Kate Warner
Kate Warner
Quilting
Join us in raising awareness for climate change.
climatechangequilt@gmail.com
© 2025. All rights reserved.